The Euro/New Zealand Dollar currency pair (also referred to as EURNZD and EUR/NZD) is a minor currency pair. In this article, we will examine how EURNZD is performing.
EURNZD Key Stats
- 2021 high: 1.7163
- 2021 low: 1.6063
- YTD high: 1.7548
- YTD low: 1.5593
- YTD % change: 4.31%
EURNZD Forecast
The EURNZD isn’t a pair on many people’s radar, and if you zoom out to the monthly chart, its move has been relatively sideways compared to previous years pre-2013. While the recent break above1.7061 could be key for a continued bullish move, it is not something we would pin our hats on. We lean slightly bullish for the pair in the near term but don’t rule out a pullback over the next few days/next couple of weeks.
EURNZD Fundamental Analysis
Developing a bias in the currency market is integral to a trader’s overall strategy. Investors are constantly entering and exiting the market, and this is what moves the pair on a daily basis over the long term. Therefore, it is important to watch factors such as unemployment, government spending, GDP and inflation, and more.
Over recent months, the euro has faced significant challenges, with the ECB’s decisions causing much debate. The euro was negatively impacted earlier in the year, with Russia’s halt to gas supplies heightening fears of a deepening energy crisis. Energy prices rising resulted in inflation in Europe surging, weighing on the euro, and in 2022 the currency, against many other majors, tumbled as Europe attempted to break away from Russian oil and gas supplies. Despite an initial delay, the ECB has been raising rates and is expected to continue while inflation remains near record highs.
The New Zealand Dollar is generally impacted by tourism. The currency benefits as the number of visitors increases. However, since the pandemic began, tourists have fallen well below their usual numbers. This has had a negative impact on the NZD. In 2022, tourists travelling to New Zealand have shown signs of increasing, although it is still well below the levels seen before the pandemic. As for inflation, New Zealand has not been immune to the significant rise. Therefore, the Reserve Bank of New Zealand has had to raise rates considerably.
Related Articles
- NZDUSD Forecast And Live Chart
- AUDNZD Forecast And Live Chart
- What Are Minor Forex Pairs?
- Forex Charts
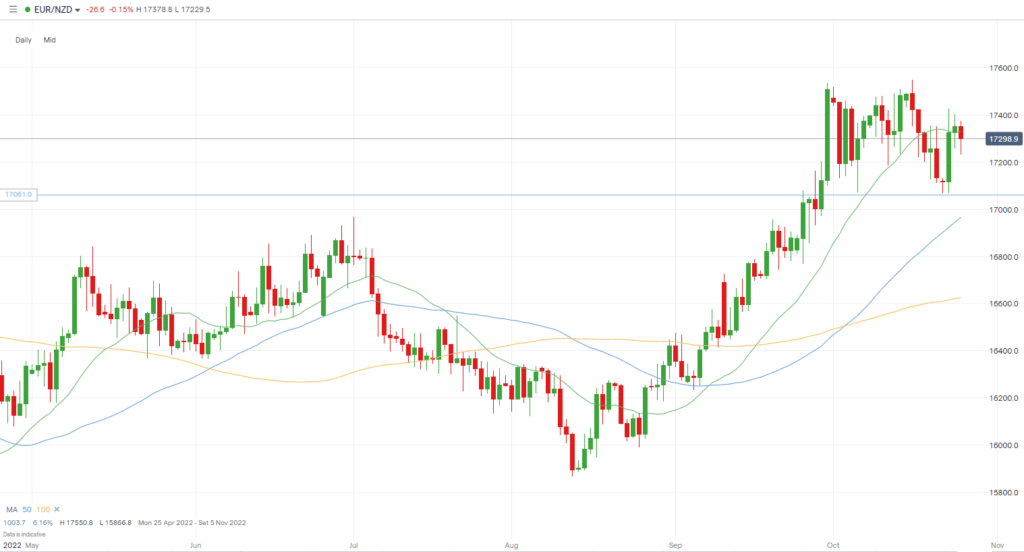
EURNZD Technical Analysis
Over the course of 2022, the EURNZD has been up and down, up 4% at the time of writing. As always, we keep an eye on crucial support and resistance levels, with 1.7061 an area we see as a key level for a potential downside move if it were to break. Below that, we look to 1.6847 and 1.6530 as other potential downside targets on a long-term basis.
On the other hand, to the upside levels include the pair’s previous highs of 1.7548 and 1.7928 are areas from which the price could retrace. The EURNZD has.
The pair is currently trading well above its 50 and 100-day moving average on the daily chart. However, it tends to stick fairly tightly to the 20-MA, and the recent fall below may indicate a near-term retracement.
Trade EURNZD with our top brokers
| Broker | Features | Regulator | Platforms | Next Step | |
|---|---|---|---|---|---|
|
73% of retail C... |
|
FSA SC | MT4, MT5 | ||
 Your capital is at risk
Founded: 2014 Your capital is at risk
Founded: 2014 |
|
FSPR | MT4 | ||
 Your capital is at risk
Founded: 2006 Your capital is at risk
Founded: 2006Europe* CFDs ar... |
|
ASIC, FSA, FSB, MiFID | MetaTrader4, Sirix, AvaOptions, AvaTrader, Mirror Trader | ||
|
Between 74-89 % of retail investor accounts lose money when trading CFDs |
|
ASIC, FCA | MetaTrader 4, MetaTrader 5, cTrader | ||
|
77 % of retail investor accounts lose money when trading CFDs with this provider. You should consider whether you understand how CFDs work, and whether you can afford to take the high risk of losing your money. |
|
ASIC, CySEC, FCA | eToro Platform | ||
|
|
|
ASIC, CySEC, IFSC | MT4 Terminal, MT4 for Mac, Web Trader, iPhone/iPad Trader, Droid Trader, Mobile Trader, MT5 | ||
 Your capital is at risk
Founded: 2006 Your capital is at risk
Founded: 2006 |
|
CySEC, DFSA, FCA, FSB, SIA | MetaTrader4, MetaTrader5, cTrader, FxPro Edge (Beta) | ||

Forextraders' Broker of the Month
BlackBull Markets is a reliable and well-respected trading platform that provides its customers with high-quality access to a wide range of asset groups. The broker is headquartered in New Zealand which explains why it has flown under the radar for a few years but it is a great broker that is now building a global following. The BlackBull Markets site is intuitive and easy to use, making it an ideal choice for beginners.