
Candlestick patterns provide instantaneous insights for trading opportunities. If you are to become an experienced forex trader, you will need to enhance your knowledge base with these curious little shapes. They can be single candles, but a series of them can telegraph a major reversal in the making. One of these important candle groupings is known as the bullish three inside-up pattern.
This pattern comprises three candlesticks that occur at the end of a downtrend, as depicted in the following graphic:
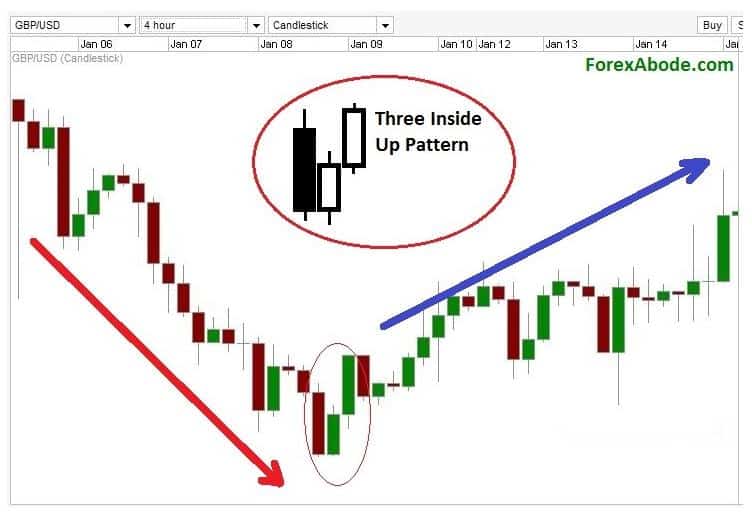
Source: Forexabode.com
The bullish three inside up series occurs at the end of a strong downtrend. The red down candle must be a strong push from sellers, but they may have pushed too hard. As a result, the next green candle connotes a reversal, but the body of the candlestick must be within the previous candle’s body. The third candle gives the shape its final name, in that this ‘up’ candle must be strong enough to close above the close for the previous red candle.
Candlestick patterns are a gift from the 18th-century Japanese rice futures trader Honma Munehisa, known in his day as the ‘God of Markets’. It may have taken a considerable amount of time for these techniques to migrate to the West, but today they are the most popular way for visually representing open, close, high and low price values during a specified time period for a chosen asset.
The bullish three inside up pattern is one of the more common reversal candlestick groupings. Forex traders tend to see it as more of an alert than an absolute signal for a quick reaction. When combined with other technical tools such as Fibonacci ratios or oscillators, the pattern can highlight a higher potential for a sudden reversal or the continuation of a trend after a pullback. All traders need an edge in the volatile forex market, and this three inside up pattern can give you one.
In this article, you will learn the rules for detecting this pattern, what it means with respect to market psychology, how and when to trade when you observe this grouping, and how to enhance your odds when you see it. Understanding candlestick formations and the signals they convey is a necessary prerequisite for effective trading, if only to know what other more knowledgeable traders might be thinking or how they might be planning to react.
What Is the Bullish Three Inside Up Candlestick Forex Pattern?
The Bullish Three Inside Up Candlestick Pattern is just one of a series of candles that signify that either a reversal or a continuation of a trend is a highly probable event. A trader must only recognize the pattern as it forms and then prepare to execute a related strategy for gain, without the need to draw support/resistance lines or employ other technical devices. Although these patterns can be powerful indicators in their own right, it is always advisable to use additional technical tools to confirm the timing of your desired plan of attack.
In order to recognise this three inside up pattern, there are four rules to follow. As you read each of the following rules, review the candles within the green circle in the EUR/GBP daily chart, courtesy of eToro, presented below:
- The market must be trending down or moving lower.
- The first in the series must be a rather longish red down candle.
- The second in the series must be a green up candle, and its body must form within the body of the previous red candle and be at least 50% of the red candle’s body.
- Lastly, the third candle must also be a green up candle, which is strong enough to close above the body of the previous red down candle.
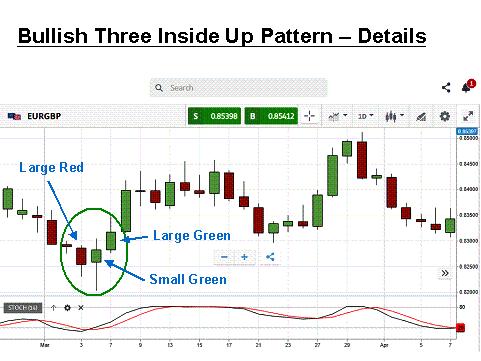
Source: eToro
How reliable is this bullish pattern? The three inside up series is quite common. It is easy to spot, but as it is so prevalent, its reliability may be dampened a bit. It can be a false signal, but, as with all indicators, a wise trader is smart to require a confirmation from other sources. As you might have expected, there is also a bearish version of this candlestick grouping. It is called the bearish three inside down pattern. It occurs when momentum slows in an uptrend or there is a brief pullback from a downtrend.
What Does the Bullish Three Inside Up Candlestick Mean?
Candlestick patterns are one of the few mechanisms we have that instantly tell us what is going on in the market and how market psychology is changing. Every piece of information is important, from the size of the bodies, to the length or absence of the wicks/shadows, and to the actual positioning of each candle relative to its other companions.
What are the three candles of the three inside up pattern communicating to us? Let’s look at the previous graphic and describe each candle:
- First candle: Typically a long red down candle, where sellers are enjoying the trend but are a bit complacent.
- Second candle: The decline suddenly stops and the market trades positive but over a short range, where its body is at least 50% of the first candle but it is completely within it. This candle has also been called a bullish harami, another candlestick that signals a potential reversal in the making. Fear begins to creep into the minds of weak hands.
- Third candle: A larger green up candle forms quickly, closing above the high of the first red candle, as the shorts begin to feel a squeeze. The size of the body is a good indication of the force behind the reversal, as the shorts exit and new traders join the uptrend.
The three inside up pattern happens quite often, which means that the trader needs to be more discerning before leaping to a conclusion that the market is truly reversing. It is definitely an alert worthy of further study. How long and strong was the previous downtrend? How deeply could a short squeeze create buying momentum? What do other indicators say about a potential reversal? Other traders in the know will be asking these same questions.
How to Trade the Bullish Three Inside Up Candlestick Forex Pattern
For educational purposes, let’s discuss a trade example, using the previous chart:
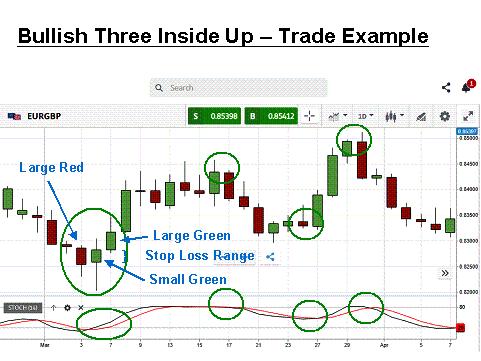
Source: eToro
As the three inside up pattern is a common one and more capable of sending false positive signals, developing a trading strategy is somewhat determined by the level of risk that a trader is willing to assume. Gaining answers to the questions at the end of the last section will help, but experience may also be a big factor. More aggressive traders will react to the size of the third candle’s body, whereas a more conservative trader may want confirmation from other indicators.
For further confirmation, we have added stochastics, a preferred oscillator that gives off reliable signals when trends are present in the forex arena. In this case, the stochastics are confirming a go-long strategy for the euro. The fourth candle actually reveals a squeeze in process. Inserting a stop loss can occur anywhere from the close of the first candle to the open of the third at your discretion.
Choosing an exit point with this trade is the next consideration. Squeeze momentum can sometimes subside as quickly as it formed, but a wise trader will expect a small pullback, as ‘hit-and-run’ traders take their gains. Once again, an aggressive trader might exit, buy on the dip, and then hold until later, allowing the stochastics to suggest appropriate entry and exit points.
Whether you employ one or three trades in this situation will depend on how much risk you wish to take on, but the yield on this trading example could range from 250 to 400 pips, as this three inside up pattern plays out in the market. Take time on your demo system to search for other examples in the archived data to assess how bodies and wicks can vary and what the variances might portend. When confident, try out this trading system in real-time.
Conclusion
Being an effective forex trader for the long term requires skill and a formidable knowledge base of methods for discerning visible changes in market psychology. Candlestick pattern recognition can be an excellent addition to your trading repertoire, and reacting to a bullish three inside up candlestick pattern is one way to improve your trading prowess.
The three inside up formation, however, is more common than many other reversal patterns, and for that reason, it is advisable that more confirmation be obtained from other technical sources before executing a trading strategy. Become familiar with its nuances, and then incorporate it into your daily trading routine.
Trade Candlestick Patterns with Top Forex Brokers
| Broker | Features | Regulator | Platforms | Next Step | |
|---|---|---|---|---|---|
|
73% of retail C... |
|
FSA SC | MT4, MT5 | ||
 Your capital is at risk
Founded: 2014 Your capital is at risk
Founded: 2014 |
|
FSPR | MT4 | ||
 Your capital is at risk
Founded: 2006 Your capital is at risk
Founded: 2006Europe* CFDs ar... |
|
ASIC, FSA, FSB, MiFID | MetaTrader4, Sirix, AvaOptions, AvaTrader, Mirror Trader | ||
|
Between 74-89 % of retail investor accounts lose money when trading CFDs |
|
ASIC, FCA | MetaTrader 4, MetaTrader 5, cTrader | ||
|
77 % of retail investor accounts lose money when trading CFDs with this provider. You should consider whether you understand how CFDs work, and whether you can afford to take the high risk of losing your money. |
|
ASIC, CySEC, FCA | eToro Platform | ||
|
|
|
ASIC, CySEC, IFSC | MT4 Terminal, MT4 for Mac, Web Trader, iPhone/iPad Trader, Droid Trader, Mobile Trader, MT5 | ||
 Your capital is at risk
Founded: 2006 Your capital is at risk
Founded: 2006 |
|
CySEC, DFSA, FCA, FSB, SIA | MetaTrader4, MetaTrader5, cTrader, FxPro Edge (Beta) | ||

Forextraders' Broker of the Month
BlackBull Markets is a reliable and well-respected trading platform that provides its customers with high-quality access to a wide range of asset groups. The broker is headquartered in New Zealand which explains why it has flown under the radar for a few years but it is a great broker that is now building a global following. The BlackBull Markets site is intuitive and easy to use, making it an ideal choice for beginners.