

The asset arena for traders and investors covers a vast field from equity securities to currencies, commodities, real estate, bonds, and a broad category in itself: alternative investments. However, all of them share one crucial characteristic: volatility. The latter is a force emerging in any environment where humans change their minds, sometimes in small pockets and frequently en masse. Unfortunately, as much as the theory dictates that logic is vital when committing funds to hard assets, extreme emotions such as ‘panic’ or ‘exuberance’ often take over. Fortunately, history indicates that herd mentality is a fundamental driver in volatile situations, thus creating a trend that may last for minutes, hours, days, weeks, and sometimes months.
As a result, entities and individuals immersed in the markets described above fret over finding the ‘magic elixir’ – the holy grail that can predict directional change and its velocity before it occurs. One such group is the chartists. One could even say that collectively, chartists are in a cult committed to technical analysis. They swear by their ability to foresee future price behaviour for any investment/trading opportunity that lends itself to graphical representation. Indeed, graphs are the core platform for chartists, taking the latter into the stratosphere with regard to complexity and mathematical configurations that align closely.
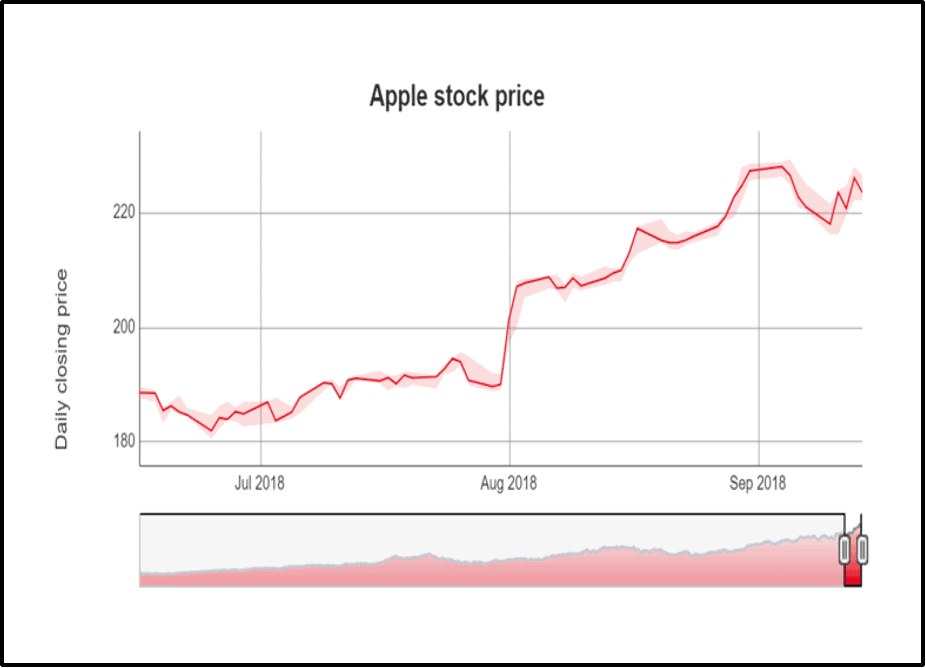
Before we get started on this subject, let’s clarify the difference between a chart and a graph. ‘Charting’ is a general, catch-all term that converges on viewing data via graphical representation. ‘Graphing’ refers to analysing a single chart within the all-embracing charting category, where the chartist plots points that connect two variables (such as price and time), as shown in the diagram below:
Chartists believe that as historical circumstances repeat, people will react similarly. Moreover, the way that graphs form and assume different shapes enables analysts to project the future path of the variable combination, thus pinpointing where the price is going from where it has been and sits currently – in other words, leveraging history to predict the future. Indeed, if there’s truth in these charting benefits, then flashing signals of when to enter or exit volatile markets makes it a cinch to locate trends. To find out if it’s an easy task, read on.
Background and Context
Controversy
As one can imagine, there’s considerable controversy attached to charting. Why? Because there are different schools of thought – the fundamentalists being the most vocal critics. The latter category believes that examining economic drivers and/or financial statement ratios is the best path to predicting future trends. For example, equity securities on registered exchanges issue financial reports quarterly. Similarly, Fed inflationary viewpoints, unemployment rates, sellers’ or buyers’ markets in real estate, GDP growth or retraction, and many other data reports make news headlines constantly. Essentially, fundamental analysis depends on a slower timeframe, which its proponents insist creates the right conditions for more accurate price predictions.
Moreover, the purists in the fundamentalist category point to the Random Walk Theory, which suggests that the current price is the only consideration because it’s the net result of history plus everything going on now with zero connection to the future. Therefore, prices tomorrow can go in any direction (i.e., a random walk). The academics reject that future patterns emerge from pinning adjoining points on a graph – alongside emitting high-probability trading signals. They’re quick to highlight chartists’ false signals when they occur to validate their antagonistic stance.
Nonetheless, charting as a ‘science’ has come a long way and, like it or not, has a massive following based on forex and other traders demonstrating success strategies in turbulent markets – much to the chagrin of academics and politicians in opposing thought schools. In addition, it has progressed to the point where those fully into charting can earn the title ‘Chartered Market Technician (CMT)’ as a professional designation.
Related Articles
- A Few General Principles on Technical Analysis
- Interest Rates and Volatility
- Forex Indicators: Is There a Holy Grail Out There?
Understanding the Chartist Mentality
Similar to politics with its left and right-wingers, some chartists virulently oppose fundamentalist thinking as narrow-minded and blinkered. Still, middle roaders use fundamental analysis to decide on the specific securities to include in the forthcoming tech-centric portfolio, where the final decisions rely on charted patterns.
Charting is the opposite of a one-trick pony with a broad and deep resource pool of analytics that focuses on price patterns and indicators. The savviest participants adopt an integrative approach, accepting that one indicator generally isn’t enough to provide essential insight. Therefore, one technique may identify a promising pattern, whereas others come in simultaneously to confirm it. It typically results in seasoned chartists adopting a style with a go-to compendium that works well for the market types they favour most. It’s challenging to detect a consensus on the leading combinations because the most reliable patterns emerge infrequently. Therefore, software packages capable of scanning thousands of charts in a fraction of the human time to do the same, and significantly more accurately, have entered the charting arena as a mainstream tool.
Charting Examples
The key to charting success is pattern recognition. The field can be severely confusing – there are hundreds of candlestick patterns with numerous overlaps. However, as intimated above, savvy chartists avoid the hassle and frustration with AI software options that take the sweat out of the processes. These digital tools are capable of finding the formations, and they assist with pinpointing the best entry and exit points. Notably, reputable brokerage firms provide charting software to their traders, notwithstanding that advanced chartists customise their resources with independent products. As an example of the latter, the Nison Candle Scanner can highlight 28 of the most popular charting patterns that focus on answering users’ most challenging quandaries.
Once a price trend is detected, chartists identify it as the type that:
- Does a U-turn – essentially reversing the direction (referred to as a reversal pattern).
- Continues on a steady path or accelerates in the same direction (referred to as a continuation pattern).
We can’t examine every pattern in this article. So, we’ve selected the massively traded ‘Three-line Strike Candlestick Pattern (3-LSC)’ to demonstrate how charting works for all of them. 3-LSC appears in two ways:
- Classic bullish (predicting that pricing will continue upward), crucially supportive of traders going long (i.e., on the buying side of the trade).
- Classic bearish (predicting that pricing will continue downward) – pivotal for traders going short (i.e., on the sell side of the trade).
Both have distinctive shapes (mirror images) and generally reliable continuation patterns, as you can see below:
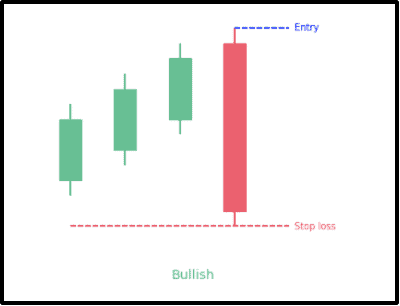
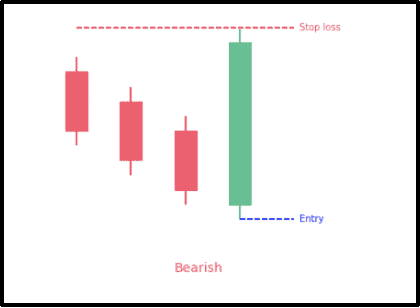
Candlestick (i.e., commonly called a ‘bar’) characteristics in both patterns are as follows:
- Always four bars, with the first three bars signalling the trend direction (i.e., Bullish = Green = UP; Bearish = Red = DOWN).
- In each pattern, bar #4 goes opposite to bars 1-3, boomeranging higher/lower than the original bar #1 level.
- When that happens, it’s called an engulfing bar – an entry point for the trader after confirming the trend.
- Confirmation may mean waiting for bar #5 on the bullish pattern going green and on the bearish chart going red.
The Psychology Behind the Three-Line Patterns
What’s occurring here is that the traders/investors driving the trend upward or downward want to cash in their chips each time the third bar completes, then wait for the engulfing pullback, confirm, and enter the next cycle. Indeed, traders may be lucky enough to repeat winning patterns many times.
- In the bullish version, traders buy the asset expecting it to go up, selling higher when the third bar delivers a higher price.
- Conversely, a short trader sells the security at the start price for future delivery, buying it lower at the third red bar price to make a profit.
The engulfing bar defines the psychology behind the trade. Why? Because it marks the point when the ‘herd’ (less-sophisticated traders), fearing that they’ve missed the boat, jump in, pushing the price lower/higher than when it started the cycle, allowing the savvy trader to step in and take advantage of the pullback.
A cautionary note: If the ‘boomerang’ as described above overshoots the first bar by too much, the trend leaders sometimes hesitate, and the fourth bar peters out, thus imploding the trend (i.e., it fails to confirm).
Conclusion
Everything above points to charting as a viable methodology in volatile environments. However, in many ways, it’s more ‘art’ than ‘science’ because change intensity can disrupt even the best-laid formulas. Thus, trend failures inevitably hit the most resilient trends, so we advise you always to place an automatic stop-loss in your trading strategy. We strongly advise you to take a clinical approach, which means:
Stop-losses work for all traders, whether you are a chartist or not. These tactics ensure that you won’t chase trends with failed pattern confirmations. So, once your stop-loss triggers, move on to the next trade without regret. Finally, we’ve only provided the tip of the gigantic charting iceberg. If it resonates with you, review the charting support that reputable brokers offer and hitch your boat to the one that demonstrates a resource pool best suited to novice traders. They will teach you about other critical patterns plus proven techniques such as Bollinger Bands, relative price indexes, oscillators, and many more to assist charting accuracy.

Forextraders' Broker of the Month
BlackBull Markets is a reliable and well-respected trading platform that provides its customers with high-quality access to a wide range of asset groups. The broker is headquartered in New Zealand which explains why it has flown under the radar for a few years but it is a great broker that is now building a global following. The BlackBull Markets site is intuitive and easy to use, making it an ideal choice for beginners.