

Technical analysis is an essential skill that most forex traders take very seriously. Although there are many different types of technical analysis, perhaps the most well-known involves pattern analysis.
When you look at the historical price action of any market on a price chart, it simply reflects the investment behaviour of all market participants in a graphical format. When studying price action more closely, specific investment behaviour tends to create specific chart patterns that can materialise at important decision points that can lead to trend reversals or trend continuation setups.
The purpose of this article is to focus on one popular chart pattern, the pennant pattern. We will also discuss how to identify it on a chart and show a few pennant pattern forex examples to help you trade it.
The Pennant Pattern Explained
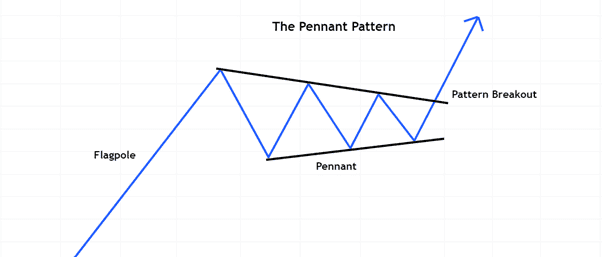
Image for illustration purposes only
The word ‘pennant’ refers to the shape of a tapering flag that has various uses on both land and sea.
The pennant pattern, as it relates to forex trading, is a type of trend continuation pattern that can form during a bullish or bearish trend.
Prior to the formation of the pennant, there will generally be an established trend, followed by a sideways trading range that becomes narrower during the ‘pennant’ part before a strong breakout follows in the same direction as the previous trend.
Traders refer to the established trend prior to the pennant formation as the flagpole, while the pattern as a whole resembles that of a flag on a pole.
Technical traders will often use trendlines to define the shape of the entire pattern, which makes it visually easier to spot on a chart. On the image illustration above, black trendlines were used to define the upper resistance and the lower support areas that price will typically reach, and reverse from, during the pennant formation phase.
Pennant patterns are also called symmetrical triangles because of how the upper and lower trendlines converge into a narrower range.
Next, we will look at how to draw the pennant pattern and then discuss how traders generally trade this popular chart formation.
How to Draw the Pennant Pattern
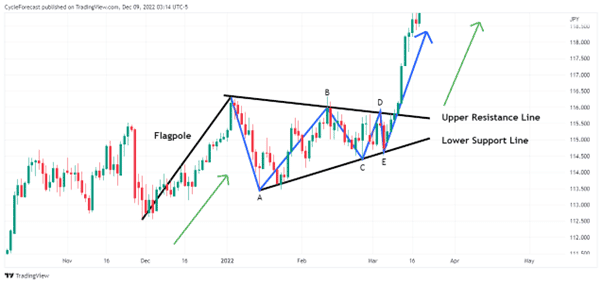
Image for illustration purposes only
Now that you know what a pennant pattern looks like, the next logical step will be to start using your platform’s trendline drawing tools to help you define the shape of the pattern.
Using trendlines, as stated before, makes it easier to identify the symmetrical shape of the pennant pattern. The closer price gets to the narrowing end of the triangle, the more likely it becomes that a breakout will occur at any moment – which can help a trader prepare for a trade setup before it happens.
Even the flagpole part plays an integral role in the ‘how to trade it’ part of this pattern, which we will discuss a bit later.
Using the bullish pennant pattern example above, price trended upward (forming the flagpole), and there was then a countertrend move lower (labelled A). Price then found support and started heading higher again, but failed to break above the point where the previous uptrend ended (point B).
When price moved lower again, it yet again found support (at point C) and bounced higher again. It is generally at this stage of the formation that traders will start thinking that they might be dealing with a pennant pattern.
As soon as price bounced higher from point C, two trendlines can be drawn. The first upper trendline can be drawn from the end of the flagpole to the high of point B and extended to the right.
The second lower trendline can be drawn from the lower point A to the end of point C and also extended to the right.
Once these two trendlines are in place, it is crucial that price finds resistance at the upper trendline at point D, followed by one final reversal lower, at which stage a trader can expect the entire pennant formation to end at the lower trendline (point E).
If price reverses upward again from the lower trendline, then that will be the signal to get ready for a breakout and a possible trade entry opportunity.
How to Trade the Pennant Pattern
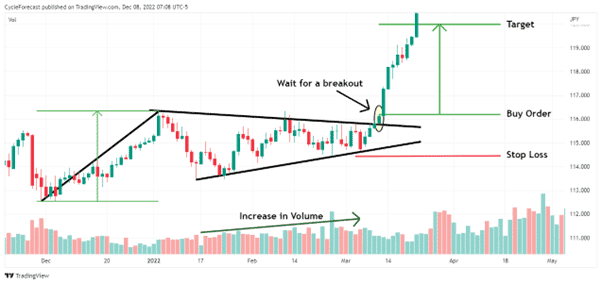
Image for illustration purposes only
What follows is a simple trading strategy that includes a volume indicator to help spot high-probability pennant pattern setups. Traders who follow patterns will often use additional technical analysis methods, such as indicators, to make better trading decisions.
Using the same pennant chart example as before, a long entry can be taken as soon as a candlestick breaks, and closes, above the upper resistance line, accompanied by an increase in volume prior to (or during) the actual breakout.
With this pennant pattern forex example, volume increased during the formation of the pennant part, though price failed on numerous occasions to break above the upper resistance trendline. This behaviour in the volume indicator signalled that the buyers were in control and that a bullish continuation was likely to follow.
As soon as the buy order is triggered, this strategy requires that you immediately place a stop-loss order below the most recent swing low (in this case point E) to limit your risk.
Once your stop-loss order has been placed, the next step is to determine a take-profit level, which is where the flagpole part of the entire pattern becomes useful.
To place your target order, simply measure the entire height of the flagpole part (green arrow and horizontal lines on the left) and project that same height from your point of entry upward to find your target level.
Note that there might be times when the breakout candle has a very large body, which would increase the distance from your point of entry to your stop loss and result in your take-profit level being further away.
When this happens, some traders will wait for a potential retest of the trendline from where price broke out of, and then enter a trade. Whatever your preference might be during such a situation, always remember to control your risk by only risking a small percentage of your total account equity on any given trade.
Bearish Pennant Pattern Example
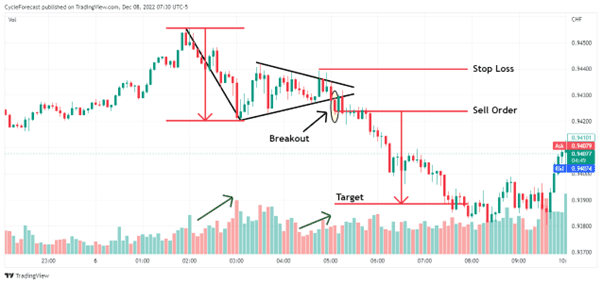
Image for illustration purposes only
Our next pennant pattern forex example formed at the early stages of a downtrend and was followed by a strong bearish continuation.
For a bearish setup, the exact same procedures can be followed to draw the trendlines and to trade the breakout. With this example, volume increased during the flagpole part, which indicated that a lot of selling pressure was present during the initial decline.
Volume also stayed relatively high during the pennant formation, dropped slightly towards the end, and increased yet again just before price boke below the lower support line.
As soon as the first breakout candlestick closed, a short position could have been taken with a stop loss positioned a few pips above the most recent swing high. The take-profit level was again determined by measuring the height of the flagpole, but this time the same height was projected lower from the entry point.
Related Articles
- What is technical analysis?
- How to create a forex strategy based on forex?
- Basic technical analysis trading manuals
Conclusion
The pennant pattern forex examples used in this article have shown how easy it is to identify this pattern and what to look out for before you attempt a trade. When it comes to pattern analysis, your trading platform’s drawing and labelling tools become very useful in helping you better visualise pattern formations.
The trade examples also included the volume indicator, which acted as an additional confirmation method to spot the highest probability trend continuation setups.
Technical traders often combine various analytical methods with patterns, and although we used the volume indicator, it might be worth exploring other indicators to see whether they will help you with your own pattern analysis.

Forextraders' Broker of the Month
BlackBull Markets is a reliable and well-respected trading platform that provides its customers with high-quality access to a wide range of asset groups. The broker is headquartered in New Zealand which explains why it has flown under the radar for a few years but it is a great broker that is now building a global following. The BlackBull Markets site is intuitive and easy to use, making it an ideal choice for beginners.