The moving average convergence divergence indicator, or MACD indicator, was invented by Gerald Appel, a stock analyst from New York, in 1979. Although this indicator was originally developed for stock trading, it works just as well in any market, including forex trading.
All technical indicators used in trading generally fall into five categories: trend, mean reversion, relative strength, momentum, and volume indicators. The MACD indicator falls under the momentum category and is considered a trend-following indicator.
In this article, we will look at how the MACD indicator is used and how to trade with the MACD indicator. We will also outline a simple MACD trading strategy and how traders could benefit from adopting this indicator when forex trading.
How is the MACD indicator calculated?
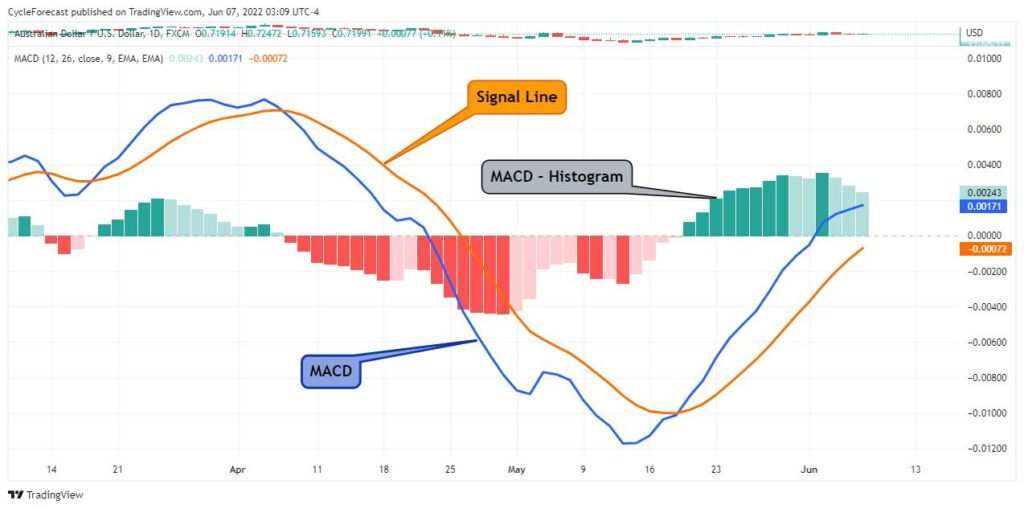
Image for illustration purposes only
The MACD indicator consists of three main components:
- The standard MACD line (blue line on chart), which is derived from subtracting a 26-period exponential moving average (EMA) from a 12-period EMA.
- A signal line (orange line) that is plotted next to the MACD line using a nine-period EMA.
- A MACD Histogram (green and red bars), which is plotted above or below a zero line whenever the signal line crosses the MACD line.
Although the calculations used to draw the individual parts of the MACD indicator might appear confusing, it is more important to focus on how this indicator is used in trading, rather than getting caught up in how and why these calculations are used.
The chart image used above displays the default settings of the MACD indicator, and most trading platforms will automatically open the indicator with these settings when applied to your chart. Next, we will look at how the MACD indicator is used in forex trading, followed by a simple MACD trading strategy with many examples.
How to use the MACD indicator in forex trading
The MACD indicator is a trend-following momentum indicator, and a lot of valuable information can be obtained from it during a trending market phase. There are two main signals that traders look out for: trend continuation signals and momentum divergence signals.
1. Trend continuation signals
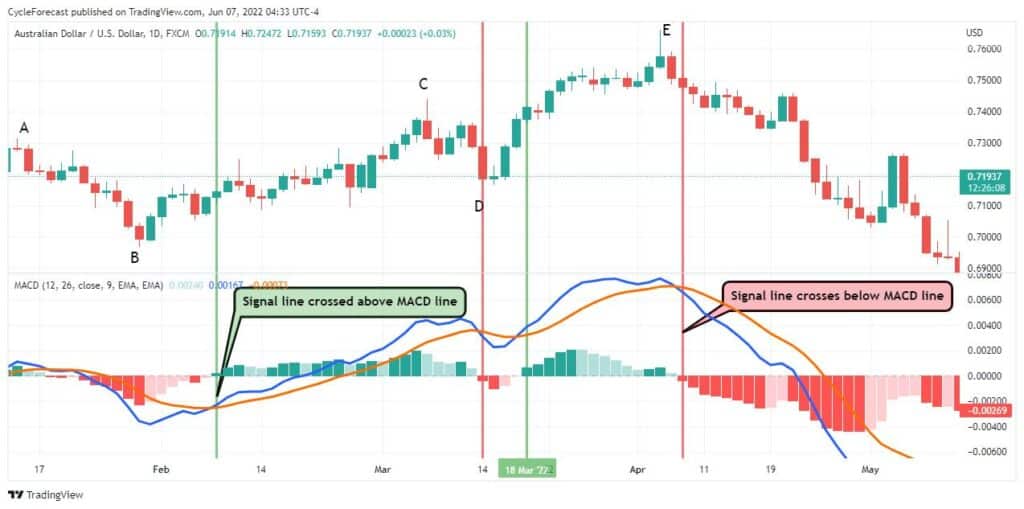
Image for illustration purposes only
The chart image above shows instances where the orange signal line crossed above and below the blue MACD line during an uptrend. For illustration purposes, green and red vertical lines were drawn on the chart at the areas where these crosses occurred.
Following the example above, from left to right, price moves lower from point A to B, but when the signal line crossed above the MACD line, a new upward trend started. This was the first early signal that traders would typically look out for when opening buy positions.
After point C, a correction lower occurred, and the signal line eventually crossed below the MACD line. This signalled a potential change in trend, warning traders that they might want to consider taking profit or tightening their stop losses.
Soon after point D, the signal line crossed above the MACD line again, signalling the first true trend continuation signal, which offered another opportunity for traders to join the uptrend.
At the final high (point E), price reversed lower and was soon followed by a bearish MACD crossover signal – from where a new downtrend started.
The trend continuation signals shown above offered excellent entry opportunities during an uptrend, but on their own, they did not offer any early warning signs that a major trend reversal was about to happen at the final top (point E).
As this indicator consists of three components, it is crucial to understand what each component is telling you. Just before the final high at point E, the MACD Histogram started showing early warning signs that the upward trend was losing momentum, which brings us to the second important signal: momentum divergence.
2. Momentum divergence signals
During the initial phases of a trend, momentum tends to increase, but as a trend nears an end, momentum tends to get weaker. When price continues to move in one direction but the momentum at which price is making new highs/lows starts decreasing, we call this phenomenon momentum divergence.
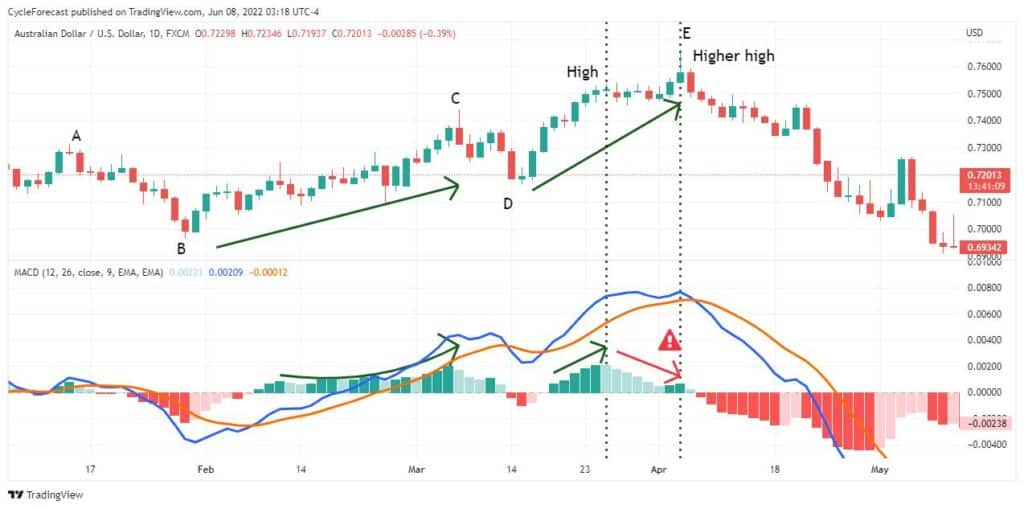
Image for illustration purposes only
Using the same chart image as before, note how the MACD Histogram started plotting larger and larger green bars during the initial phases of the uptrend, showing an increase in momentum (point B to C).
From point C to D, however, there was a decrease in momentum and the MACD Histogram plotted shorter green bars that eventually turned red for a short while when the signal line crossed below the MACD line. This is common during a corrective phase, but the upward movement in price, before the correction occurred, showed no signs of decreasing momentum, and therefore no momentum divergence.
The first warning sign that the uptrend was running out of momentum happened between the two black vertical lines on the chart above. As price continued to make higher highs, the momentum at which price was moving higher severely declined (red arrow with a warning sign on the MACD Histogram). This time, momentum divergence was clearly showing up before the final high.
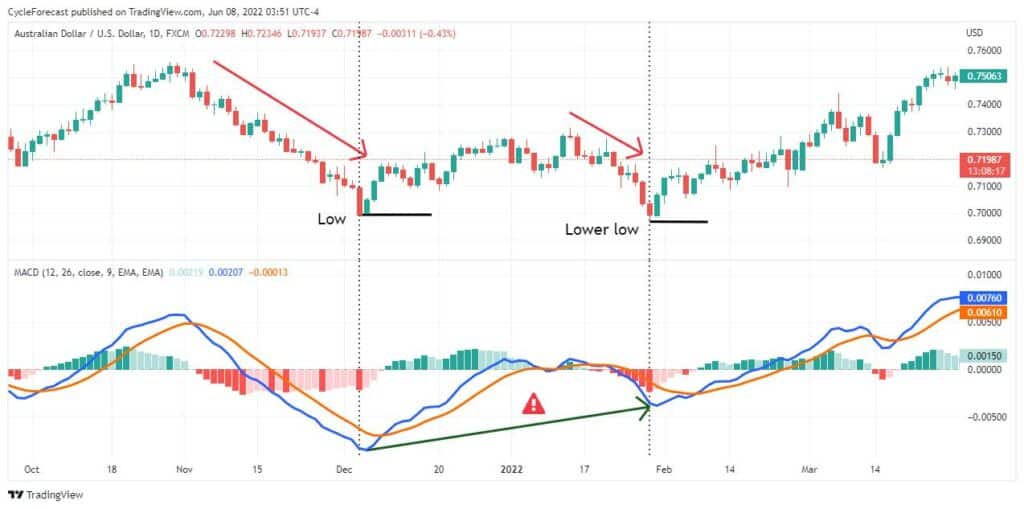
Image for illustration purposes only
Traders should also keep a close eye on the slope of the MACD and signal lines between lows or highs. The example above shows clear momentum divergence between a low and the following lower low with steep upward sloping MACD and signal lines.
Momentum divergence can therefore show up on the MACD Histogram or be detected by the slope of the MACD and signal lines, between consecutive lows and highs.
Related Articles
A simple MACD indicator trading strategy
What follows is a simple strategy that combines additional analysis techniques with the MACD indicator.
The aim of this strategy is to look for momentum divergence signals at the end of corrections and to enter trades when the signal line crosses the MACD line. As the MACD is a trend-following momentum indicator, it makes sense to use it in this way.
Knowing where corrections within a trend tend to terminate will be important and the steps below will reveal the additional analysis techniques required to do this.
Step 1: Determine trend direction
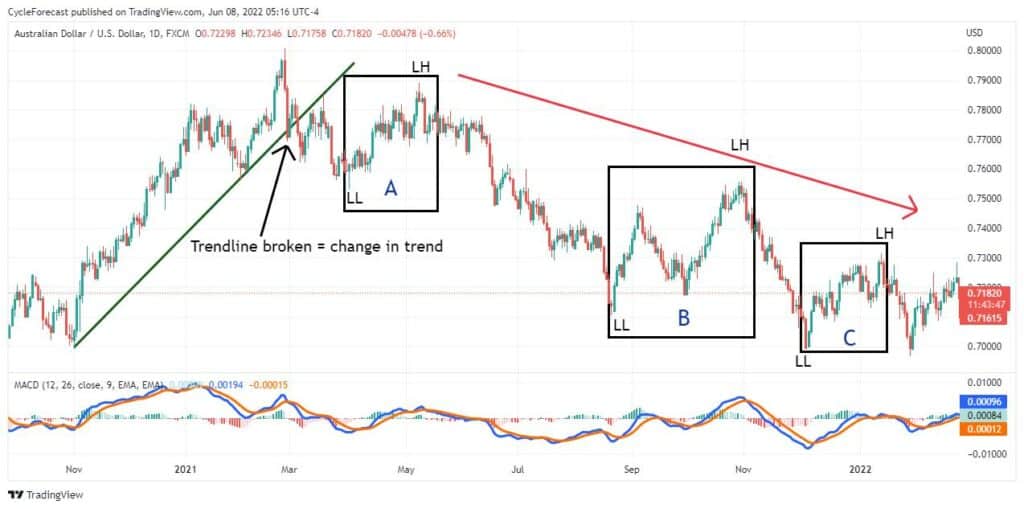
Image for illustration purposes only
The first step of this strategy requires that you figure out the current trend direction. Knowing the direction of the main trend will allow you to trade with the trend and not against it. The chart image above shows where an uptrend ended after price broke below a bullish trendline (green line on the left).
Soon after, the price structure of this market started making lower lows (labelled LL) and lower highs (labelled LH), an indication that a bearish trend has started.
Using trendlines to detect when a change in trend might occur and knowing how price structure behaves during an uptrend and downtrend will keep you on the ‘right side’ of a trend and allow you to move on to the next step.
Step 2: Wait for corrections
Now that the trend has changed from bullish to bearish, the second step requires that you wait for corrections within the trend. The previous chart image showed three black boxes labelled A, B and C, and although there were many smaller corrections during the downtrend, they were the most prominent ones that clearly showed instances of momentum divergences before they ended (we will look at these instances during step 3 and in the trade examples section below).
Next, we will zoom into the correction labelled A and show another technique commonly used to determine levels where a correction might end.
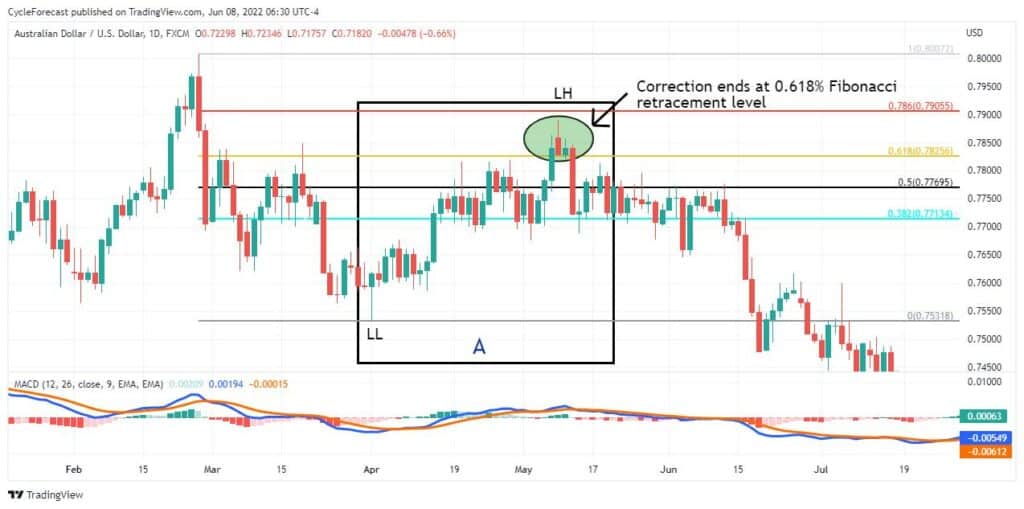
Image for illustration purposes only
The Fibonacci extension and retracement indicators are extremely popular among traders and commonly used to identify levels where corrections might end (Fibonacci retracements) or predict where trends might move toward (Fibonacci extensions).
Step 2 of this strategy used the Fibonacci retracement tool to determine where the correction, labelled A, might end before the larger downtrend resumed. On the chart example above, the correction ended at the 0.618% Fibonacci retracement level, which is considered a strong resistance level from where corrections typically reverse.
Step 3: Wait for momentum divergence
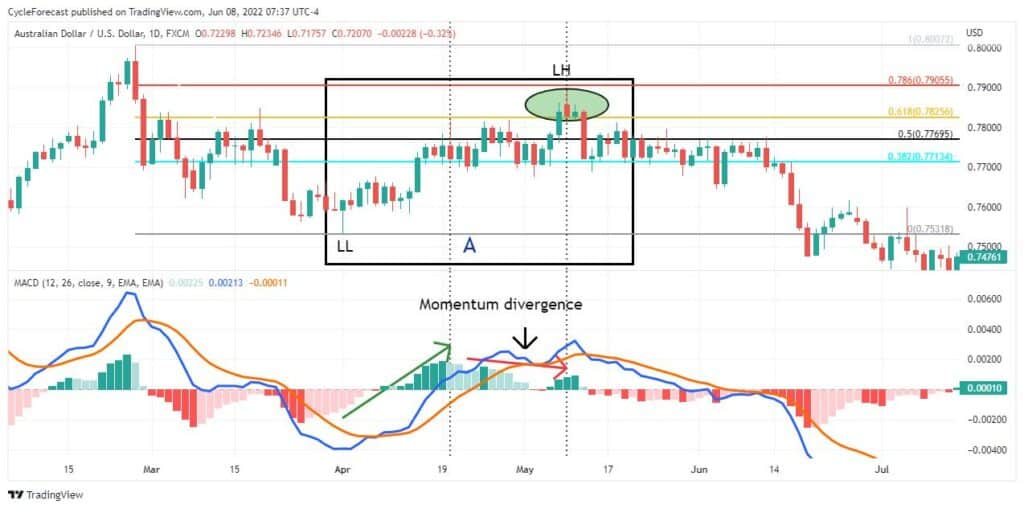
Image for illustration purposes only
Step 3 requires the presence of momentum divergence on either the MACD Histogram or the MACD and signal lines, as shown earlier.
At the start of the correction, price moved higher with an increase in momentum, and although a small corrective phase took place after the first black vertical line, price soon moved higher again but this time with less momentum.
When momentum divergence shows up during a correction and it happens at an important Fibonacci level, there is a high probability that the correction is about to end. Next, we will look at the trade entry and management procedures.
Step 4: Wait for the MACD crossover signal and enter a trade
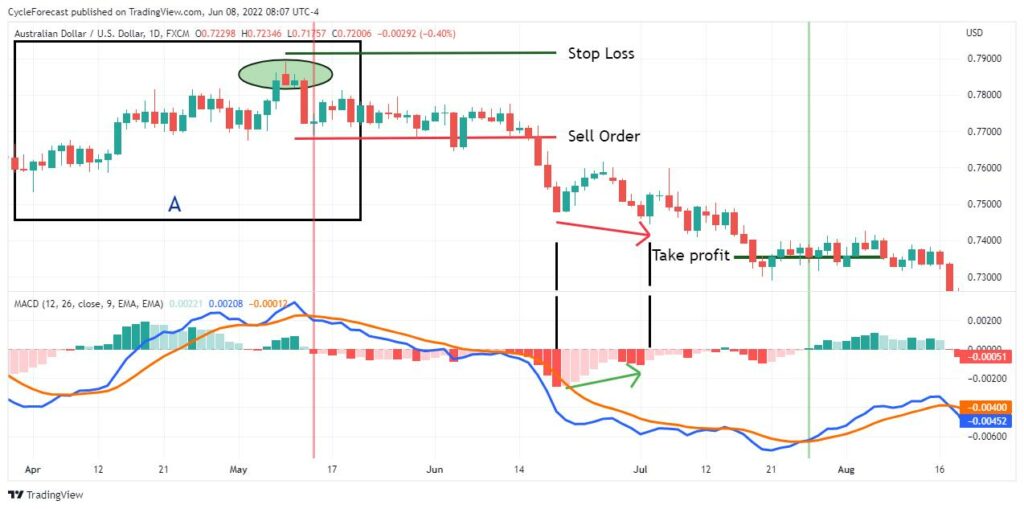
Image for illustration purposes only
After price reached a major Fibonacci retracement level and momentum divergence showed up, the final step explains how to enter and manage a trade position using the MACD crossover signals.
The first time the signal line crossed below the MACD line (red vertical line) was slightly after the correction ended and presented an opportunity to place a sell order a few pips below the candle that caused the MACD crossover signal.
Once the sell order was triggered, a stop loss was placed slightly above the recent swing high. This strategy does not require a fixed target but relies on exiting your position once the first MACD crossover signal appears in the opposite direction (green vertical line).
Another trade management technique to consider is to move your stop loss to breakeven once you notice momentum divergence on the MACD Histogram. This can be done to avoid a profitable position potentially turning into a loss.
Sometimes, the resulting trend might only last for a short while, but when a powerful trend-continuation phase happens, you could be sitting on a profitable position by the time the opposite MACD crossover signal appears.
The Best Forex Demo Accounts
To master the MACD indicator it is important that you practice using it. Reading the signals the indicator gives and correctly timing your entry and exit points are skills that need to be mastered in order to maximise your profits. This is where a forex demo account comes in: It allows you to practice your new strategy without risking any of your hard-won capital. Below we have picked out some of our favourite forex demo accounts to help you out.
| Broker | Features | Regulator | Platforms | Next Step | |
|---|---|---|---|---|---|
|
73% of retail C... |
|
FSA SC | MT4, MT5 | ||
 Your capital is at risk
Founded: 2014 Your capital is at risk
Founded: 2014 |
|
FSPR | MT4 | ||
 Your capital is at risk
Founded: 2006 Your capital is at risk
Founded: 2006Europe* CFDs ar... |
|
ASIC, FSA, FSB, MiFID | MetaTrader4, Sirix, AvaOptions, AvaTrader, Mirror Trader | ||
|
Between 74-89 % of retail investor accounts lose money when trading CFDs |
|
ASIC, FCA | MetaTrader 4, MetaTrader 5, cTrader | ||
|
77 % of retail investor accounts lose money when trading CFDs with this provider. You should consider whether you understand how CFDs work, and whether you can afford to take the high risk of losing your money. |
|
ASIC, CySEC, FCA | eToro Platform | ||
|
|
|
ASIC, CySEC, IFSC | MT4 Terminal, MT4 for Mac, Web Trader, iPhone/iPad Trader, Droid Trader, Mobile Trader, MT5 | ||
 Your capital is at risk
Founded: 2006 Your capital is at risk
Founded: 2006 |
|
CySEC, DFSA, FCA, FSB, SIA | MetaTrader4, MetaTrader5, cTrader, FxPro Edge (Beta) | ||
Example MACD indicator strategy trades
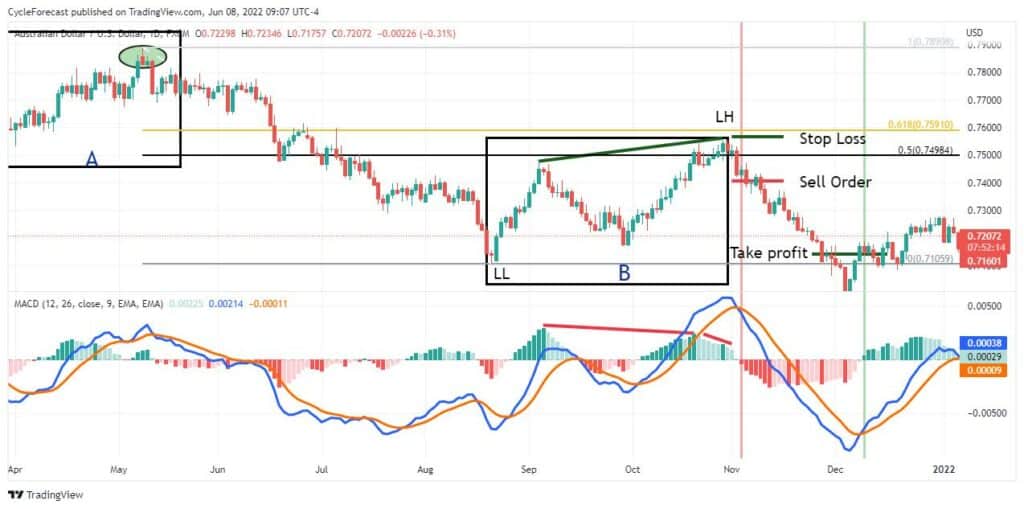
Image for illustration purposes only
Previously, we marked three major corrections on our chart example as A, B and C. The trade example above shows a close-up of the correction we marked as B, which shares a lot of similarities in price behaviour compared to the previous correction.
Correction B showed clear instances of momentum divergence on the MACD Histogram, leading up to the final high, and price found resistance between two important Fibonacci retracement levels.
As soon as the first MACD crossover signal occurred, it was time to enter a short position and manage it according to our previously mentioned entry and exit steps.
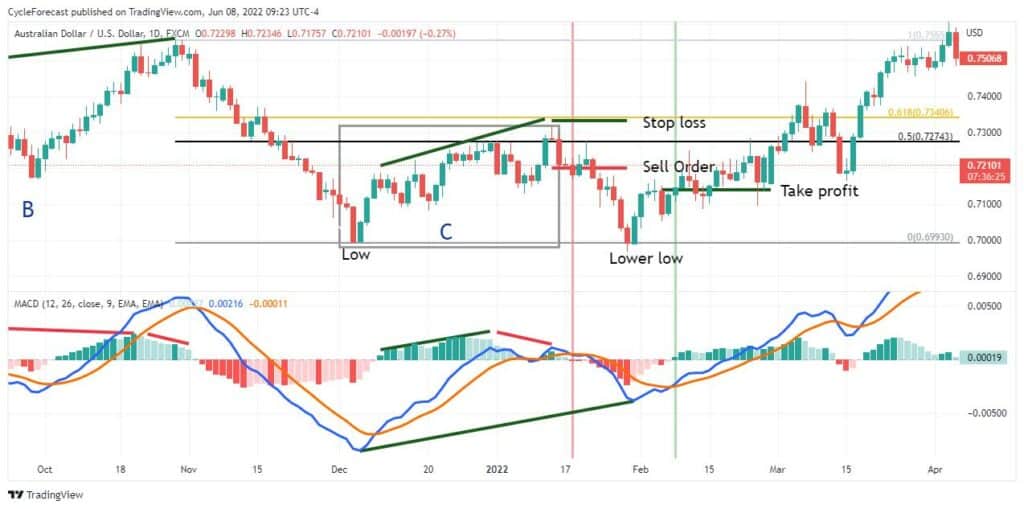
Image for illustration purposes only
Our final chart example shows the trade levels during correction C, with the MACD crossover entry and exit signals. We looked at this example before when we discussed momentum divergence signals between the MACD and signal lines.
Although the profit potential on this setup was far less than the previous two corrections, the huge momentum divergence that occurred on the MACD and signal lines was an early warning sign that it was time to consider exiting this position, rather than waiting for the opposite MACD crossover signal.
Conclusion
Novice traders can easily get overwhelmed by the wide selection of indicators on offer when they first embark on their trading journeys.
There is, however, a good reason why the MACD indicator is still favoured by many experienced traders. It simply continues to work well for what it was designed for and offers valuable insights into all market conditions; it helps give clear signals and identify trend directions so you can trade with the trend and not against it. Furthermore, noticing the momentum divergence on the MACD Histogram can help you avoid a profitable position potentially turning into a loss. There are many advantages to using this indicator in your trading.
The simple strategy included in this article has shown you how to trade with the MACD indicator and will hopefully be a good starting point for your own trading journey.

Forextraders' Broker of the Month
BlackBull Markets is a reliable and well-respected trading platform that provides its customers with high-quality access to a wide range of asset groups. The broker is headquartered in New Zealand which explains why it has flown under the radar for a few years but it is a great broker that is now building a global following. The BlackBull Markets site is intuitive and easy to use, making it an ideal choice for beginners.