Introduction
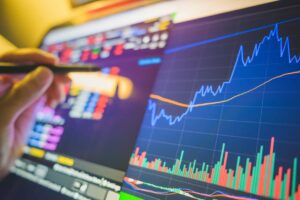
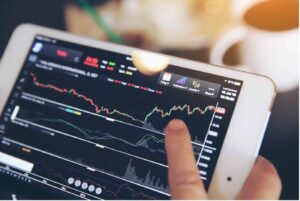
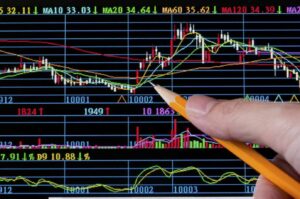
Most forex traders will use a range of forex indicators to try to make the most profitable trading decisions. Forex indicators, also referred to as technical indicators, are trading tools that online traders can use to generate buy and sell signals, monitor price trends, and attempt to predict future price action. The process of using forex indicators to inform trading decisions is often referred to as technical analysis.
While forex indicators are useful, they are not infallible, so it is important to understand exactly how they work, as this can help traders recognise false signals, and know when to cross-check the signals that one indicator is providing against the signals being given by other indicators.
In this article, we’re going to look at how to use indicators in forex trading, and discuss some of the best forex indicators to use, depending on your objectives. You will need to take a look at some of our more in-depth articles on the individual forex indicators to learn exactly how to use each one, but this article will give you a solid overview of the different tools available and what they do.
Forex Indicators Explained
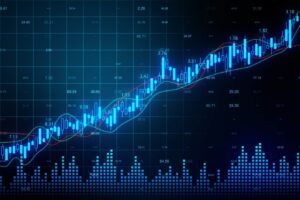
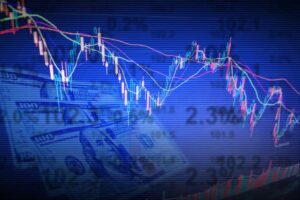
Forex indicators are tools that examine and analyse market data. Forex indicators are not actually predictive in nature. They examine historical data, such as currency price, volume and market performance, and attempt to forecast how the market will behave in the future based on past data and patterns. This is why forex indicators cannot perfectly predict what will happen in the forex markets.
There are various types of indicators and a number of specific tools within each category. Leading indicators focus on trying to point to where the price of a currency could move next, whereas lagging indicators focus exclusively on historical data, though they are used by traders to assess patterns that tend to repeat themselves.
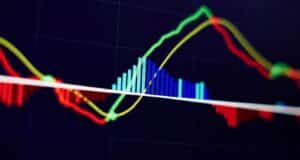
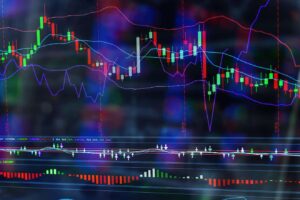
Trend indicators assess market forces to identify trends in price movements that traders can take advantage of. Oscillators essentially work by identifying high and low bands between two extreme values and then building a trend indicator that fluctuates within these two lines.
Momentum indicators attempt to work out how strong a trend is and if a reversal is likely to occur, while volatility indicators analyse how much price movement is present over a specified period, as price movement is essential to making a profit from trading.
How to Use Forex indicators
Forex indicators are commonly used by traders in a few different ways. Indicators are often used to identify entry and exit points when trading. A trader can decide in advance when a particular instrument should be bought, and when it should be sold, based on specific signals given by one or more indicators. Indicators can be used to identify a trend, and multiple indicators can then be used to confirm that trend, before actually placing a trade.
A forex indicator can also be used to confirm a trader’s analysis of a trend or situation. While technical analysis is a very useful strategy in forex trading, the markets are also highly impacted by world events, so using fundamental analysis, confirmed by technical indicators, is often a good way to be sure that the markets are behaving as expected before entering new trades.
The Best Forex Indicators
There are so many forex indicators available that it’s easy for newer traders to get confused. Here are some of the best forex indicators around:
Alligator Indicator
This forex indicator presents traders with a way to optimise market entry positions by using three lines overlaid on a forex chart to confirm the existence and direction of a trend.
EMA (Exponential Moving Average Indicator)
An EMA, or Exponential Moving Average, presents traders with lines on a trading chart that are designed to smooth out the effects of price volatility and create a clearer picture of longer-term price movements.
Momentum Indicator (MOM)
The Momentum indicator (MOM) is an oscillator that can be used to analyse small price changes and reveal the presence of a trading opportunity, or to analyse oversold and overbought moments in pricing behaviour.
Williams Percent Range
This forex indicator is also a type of oscillator and is also known as the %R indicator. It can be used to signal a possible reversal on a price chart, one or two periods in advance, helping to determine overbought and oversold conditions.
RSI (Relative Strength Indicator)
An RSI, or Relative Strength Indicator, is an oscillator that measures the relative changes that occur between higher and lower closing prices. It is another tool that is used to identify overbought and oversold conditions and determine entry and exit points.
ATR (Average True Range Indicator)
The ATR, or Average True Range Indicator, is used to measure market volatility in the recent past, which can help traders set stops and entry points for trades. Originally used in commodities trading, this tool is now a commonly used forex indicator.
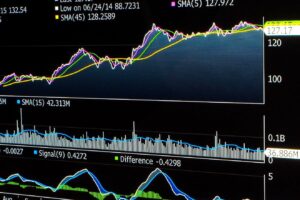
SMA (Simple Moving Average Indicator)
The Simple Moving Average (SMA) indicator is a highly popular tool used to smooth out the effects of price volatility and produce a clearer picture of price trends over time, creating buy and sell signals that can then be confirmed by other indicators.
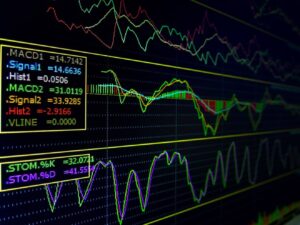
Stochastics Indicator
This is a leading indicator commonly used to determine overbought and oversold conditions, indicating the beginnings and endings of cycles in the forex market.
Divergence Indicators
Forex indicators such as the Moving Average Convergence Divergence (MACD) indicator can be used to identify divergence in the forex markets, which can be an important signal, primarily as a leading indicator.
DeMarker (DeM Indicator)
The DeMarker, or DeM, indicator is another oscillator, which attempts to measure the demand for an underlying currency pair by relating recent price action to recently closed prices.
Relative Vigor
The Relative Vigor Index, or RVI, is an indicator used to signal direction shifts and generally increases in bullish markets when momentum is rising and closing prices exceed opening values.
Parabolic SAR
The Parabolic SAR (Stop and Reverse) indicator uses the parabolic form of ‘dots’ that follow underlying trends and is employed by traders to designate optimal entry and exit points.
Heikin-Ashi
This indicator aims to remove the ‘noise’ from candlestick charts and has similar smoothing properties to a moving average. It can help determine the relative strength of a trend and pinpoint key turning points in price behaviour.
Aroon Indicator
This indicator is used to judge the strength of a trend, with absolute values signifying a strong trend, and simultaneous changes reflecting that the trend is not yet established.
CCI Indicator (Commodity Channel Index)
The CCI, or Commodity Channel Index, measures the difference between the mean price of a currency and the average of the mean price over a chosen period, providing information on the beginnings and endings of market cycles.
ADX Indicator (Average Directional Movement Index)
The ADX, or Average Directional Movement Index, is a trend indicator used to determine if a market trend will extend or gradually lose its strength.
Bollinger Bands
This indicator attempts to measure if prices are high or low on a comparative basis with relative volatility, which allows traders to anticipate changes in volatility that signal impending trend changes.
Ichimoku Indicator
The Ichimoku indicator is a type of oscillator that tends to work best at assessing longer timeframes. Developed in Japan in the 1960s, many Western traders find it a little complex, but some find that integrating it into their trading activities can be beneficial.
Fibonacci Ratios
This indicator is a popular choice with forex traders. It is used to anticipate key support and resistance levels for both upward and downward trends, to prepare various long and short position trades, and to place various stops along the way.
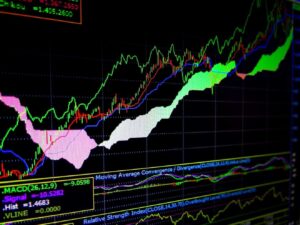
MACD Indicator (Moving Average Convergence Divergence)
The Moving Average Convergence Divergence (MACD) is a ‘lagging’ indicator designed to confirm a stock trend after it has formed, using a combination of exponentially smoothed moving averages.
Market Sentiment Indicators
Market Sentiment Indicators are, as the name suggests, tools that can be used to assess the general sentiment of investors in a specific market. These tools can be used to assess how bullish or bearish market actors are, and why, which may help forecast investors’ future behaviour.
Conclusion
While we have highlighted some of the very best forex indicators here, when it comes to which indicator to use, it very much comes down to personal choice. If you are relatively new to technical analysis and wondering how to use indicators in forex trading to the best effect, you will want to start slowly and learn to fully understand and use just one indicator at a time.
It is, however, advisable to introduce more indicators as you learn. As we have already mentioned, no technical indicator is flawless, so being able to check and confirm trends across different forex indicators is important. Good technical analysis involves just that: analysis of data from a few different tools that will ultimately allow you to put together solid trading strategies and avoid acting on potential false signals from just one tool.
Experimenting is key as it will allow you to find a suite of tools that suits your preferences, your trading style and your long-term objectives.

Forextraders' Broker of the Month
BlackBull Markets is a reliable and well-respected trading platform that provides its customers with high-quality access to a wide range of asset groups. The broker is headquartered in New Zealand which explains why it has flown under the radar for a few years but it is a great broker that is now building a global following. The BlackBull Markets site is intuitive and easy to use, making it an ideal choice for beginners.