
The “Relative Vigor Index”, or “RVI”, is a popular member of the Oscillator family of technical indicators. Although the creator of the Relative Vigor Index is unknown, its design is very similar to Stochastics, except that the closing price is compared with the Open rather than the Low price for the period. Traders generally expect the RVI to signal direction shifts and to increase in Bullish markets when momentum is on the rise and closing prices exceed opening values. Fluctuations tend to be smoother such that divergences between the index and price behaviour have more meaning.
In this article, we will explain how the RVI works and how traders can use it as one of many possible tools when interpreting market movements. We aim to explain its advantages, its history and how it is calculated, leaving you well informed about your future trading prospects.
Oscillators were some of the first technical indicators created to signify overbought and oversold conditions. Formulas may differ by design, but each indicator is trying to gauge the strength and direction of a trend by observing small divergences in how investors are reacting to current price behaviour. It is generally accepted that investors tend to overshoot their targets, but as a subset of the group diverges from the pack, warnings or alerts are triggered, which can provide an advance indication that a change in price direction is imminent.
The Relative Vigor Index indicator is classified as an oscillator since its values fluctuate between computed positive and negative values. Conceptually, trends tend to have higher closes than openings during an uptrend, and vice versa for a downtrend. The RVI indicator chart typically has a centreline at “0.00” with the RVI and its companion weighted moving average vibrating about it. High values are interpreted as a strong overbought condition, or “selling” signal, and low values as a strong oversold condition, or “buying” signal.
The Relative Vigor Index indicator is composed of two fluctuating curves – the “Green” line, which is the smoother RVI values, and the “Red” signal line. This oscillator is viewed as a “leading” indicator, in that its signals foretell that a change in trend is imminent, especially when lines cross into extreme regions or when values diverge from current pricing behaviour. The weakness in the indicator is timing and that it often gives counter-intuitive values that confuse rather than assist traders. Using an additional indicator reduces the propensity for false signals.
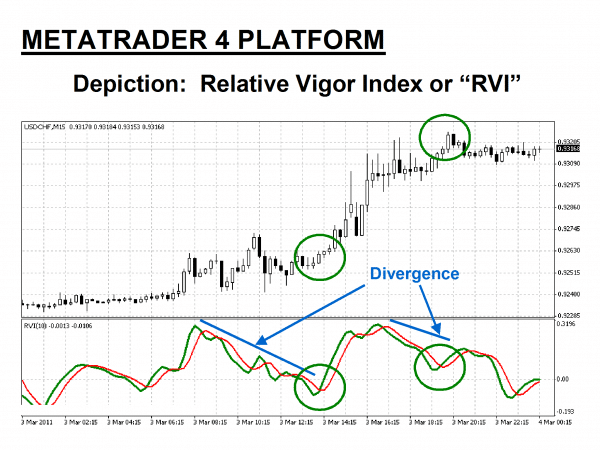
From a visual perspective, the Relative Vigor Index will mimic to a degree the pattern of price behaviour until it diverges. When the RVI pattern seems to be out of phase with general prices for the chosen asset, it is time for the trader to take note. Observe in the overview diagram depicted above how the RVI (Green) both follows and diverges from the candlestick action above it. When the RVI line crosses over the Red weighted moving average signal line, it is time for the trader to evaluate the potential trading opportunity that is forming.
The RVI is one of several oscillators offered on the MetaTrader4 (MT4) platform, but there are many proprietary systems that do not include it in their indicator arsenal. The popularity of the Relative Strength Index (RSI) and Stochastics, especially preferred by forex traders, may have influenced these decisions, but the RVI does offer another way to search for opportunities. It differs from most other oscillators in that there are no upper and lower regions defined within a 100% scaling. On the contrary, the RVI oscillates around a centreline zero base value.
Compared to other indicators, the Relative Vigor Index is produced by a rather complicated set of steps. Fortunately, these steps lend themselves to basic programming language, such that your trading platform software can perform the calculations instantly. The indicator is typically displayed at the bottom of the chart, and occasionally, the weighted moving average is omitted. Trading keys evolve around crossovers of the midline and divergences from the price behaviour of the asset being followed.
How good are the RVI alerts? As with any set of indicators, perfection is not a possibility. The RVI may denote a change is coming, but the timing of that change is another matter. False signals can happen, but the way to guard against too many errors is to combine forces with other favoured indicators to arrive at a complete picture. The odds improve with confirmation from other sources, preferably ones that focus on other aspects of a trend change. Hours of practice are also recommended to refine your step-by-step trading plan with the Relative Vigor Index.
How is the Relative Vigor Index calculated?
It is believed that the RVI emanated from traders in the commodities markets, but the beauty of technical indicators is that their functionality can easily be transferred to currency pairs, stocks, and indices.
There are quite a few steps in the process, but MT4 and other trading platforms are very good at making the complex simple to the eye. Here are the formula steps:
- Choose a “look-back” period value of “N” (Standard = 14, but a default setting of “10” is often preferred on MT4).
- RVI = (Close – Open)/(High – Low) using price data for the look-back period.
- Calculate an “N” period SMA for the RVI.
- Calculate a signal line of the weighted moving average for the last four SMA values.
Colour settings are typically Green for the RVI and Red for the WMA signal line, but you can change these to other colours if it is your preference. It is also advisable to add one or two other indicators when developing a comprehensive trading strategy. To this end, the trading example near the end of this review will also include Bollinger Bands (BB) and an Average True Range (ATR) as a complementary indicator set.
It is also advisable that you practice trading with this complete set of indicators to become acquainted with the subtle clues and insights possible with this combination. All indicators are based on previous pricing behaviour, which does not necessarily predict the future, but investors have been known to move in predictable fashions and to follow the same indicators. It is this commonality that leads to repeating patterns and the ability to gain an edge in the market.
Related Articles
How to use the Relative Vigor Index in forex trading
The primary function of a good oscillator is to provide a trader with optimal entry and exit points for a chosen asset. The Relative Vigor Index provides two avenues for determining when to open or close a position, either from a crossover or from a divergence. Let’s take another look at our Overview chart depiction:
Crossovers come in two flavours. You will want to pay close attention to when the Green RVI line either crosses the Red signal line or crosses the midline or zero value. In the example above, a strong uptrend took place. When the Green line rose above the Red line, an upward thrust was imminent. The opposite was true when it fell below the Red signal line. When the Green line was just above or below the midline, however, ranging behaviour had commenced.
What about divergences – what do those mean? Two sets of divergences are noted in Blue in the chart. Both divergences predicted that prices would fall, i.e., follow the RVI downward divergence. In both cases, the RVI approached and/or crossed the midline, a precursor of prices reverting from a trend to ranging between two tight pricing boundaries. The not-so-subtle hint is to wait until the RVI goes north with force before re-entering the market.
A simple Relative Vigor Index trading strategy
A Relative Vigor Index strategy built around the unique characteristics of the RVI can be very simple and straightforward. This particular indicator works best in a trending market. In the previous overview example, the RVI faithfully predicted the path toward a ranging period, but it is not the best tool for forecasting a breakout from range-bound activity.
For this single reason, combining the RVI with one or two other technical tools can help seal the deal. We will demonstrate how this combination works in an actual trading example in the next section, but for now, let’s focus on the Relative Vigo Index alone to see how powerful this tool can be.
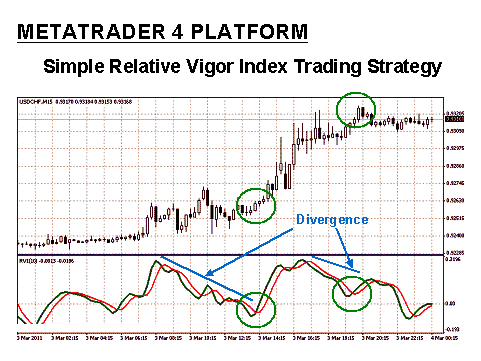
The key points of reference in the above chart include high-points, low-points, divergences, and occasional crossovers. The Relative Vigor Index appears like a rollercoaster, but it tends to be less choppy than other oscillators. The rather large divergence periods that occur on the chart can also be confusing. With practice and experience, these signals can be interpreted correctly.
In this case, the two divergent periods, where the RVI is declining while prices are still increasing, might be the opposite of what a trader might expect. The Green circles have been added to suggest when the divergent period ends and when the crossover connotes a time for action.
The simple RVI trading strategy that follows is meant only for educational purposes. Technical trading is designed to give you the edge necessary for consistent success in the market, but previous pricing behaviour does not make predictions with 100% accuracy. With that disclaimer in mind, a simple RVI trading system would then be:
- Determine your entry point after the initial Blue divergence line has completed, denoted by the Green RVI line crossing both the signal line and the zero midline in an upward thrust.
- Execute a “Buy” order for no more than 2% to 3% of your account.
- Place a stop-loss order at 20 “pips” below your entry point.
- Determine your exit point after the Green Relative Vigor Index peaks and after the next divergence completes its run, as the Red signal line crosses the Green RVI line once more.
Steps “2” and “3” represent prudent risk and money management principles that should be employed. This simple trading system would have yielded one profitable trade for 60 pips, but do remember that the past is no guarantee for the future. However, consistency is your objective, and hopefully, over time, Relative Vigor Index technical analysis will provide you with an edge.
The Best Forex Demo Accounts
To master the Alligator trading strategy it is important that you practice it. Reading the signals the indicator correctly timing your entry and exit points are skills that need to be mastered in order to maximise your profits. This is where a forex demo account comes in: It allows you to practice your new strategy without risking any of your hard-won capital. Below we have picked out some of our favourite forex demo accounts to help you out.
| Broker | Features | Regulator | Platforms | Next Step | |
|---|---|---|---|---|---|
|
73% of retail C... |
|
FSA SC | MT4, MT5 | ||
 Your capital is at risk
Founded: 2014 Your capital is at risk
Founded: 2014 |
|
FSPR | MT4 | ||
 Your capital is at risk
Founded: 2006 Your capital is at risk
Founded: 2006Europe* CFDs ar... |
|
ASIC, FSA, FSB, MiFID | MetaTrader4, Sirix, AvaOptions, AvaTrader, Mirror Trader | ||
|
Between 74-89 % of retail investor accounts lose money when trading CFDs |
|
ASIC, FCA | MetaTrader 4, MetaTrader 5, cTrader | ||
|
77 % of retail investor accounts lose money when trading CFDs with this provider. You should consider whether you understand how CFDs work, and whether you can afford to take the high risk of losing your money. |
|
ASIC, CySEC, FCA | eToro Platform | ||
|
|
|
ASIC, CySEC, IFSC | MT4 Terminal, MT4 for Mac, Web Trader, iPhone/iPad Trader, Droid Trader, Mobile Trader, MT5 | ||
 Your capital is at risk
Founded: 2006 Your capital is at risk
Founded: 2006 |
|
CySEC, DFSA, FCA, FSB, SIA | MetaTrader4, MetaTrader5, cTrader, FxPro Edge (Beta) | ||
Example Relative Vigor Index strategy trade
Now that you have a basic understanding of how to use the RVI tool, let’s look at a real-time trading example, utilizing the RVI in tandem with Bollinger Bands and the ATR. In this example, the back period is set at “10”, and we are following the “EUR/GBP” currency pair over a four-hour time period.
The first Green oval over the RVI space suggests a change is imminent. For more clarification, we look to the BBs and the ATR for timing. The bands expand and the ATR rises sharply in the second Green oval, an indication of a potential upward thrust. Our entry point for this trade occurs at this point. For our exit point, we wait for a divergence to present itself between the rising price trend and the RVI data points.
Once the RVI divergence dips below the zero midline, we wait for our next action point. Typically, for a strong uptrend, a subset of investors will cash out and cause a slight dip. Depending upon your risk tolerance level, you could exit at the last Green circle or wait for another upsurge. In this example, we closed the position after the first price rebound for a nice gain of 110 pips.
Conclusion
The Relative Vigor Index, explained within the context of other oscillators, is a very useful tool to have in your technical analysis bag of tricks. Signals and alerts are more about how the index diverges from price behaviour, although, as with the RSI and Stochastics, extreme highs and lows do represent overbought and oversold territories. The RVI is classified as a leading indicator in that it attempts to portend the future, but it is also teamed up with a lagging moving average to assist with its interpretations.
The RVI is not perfect. It can broadcast false positives, as do all indicators, but if you use one or two other indicators in tandem, you can develop an effective trading strategy for the long haul. The best advice is to go virtual – practice on your broker’s free demo system to ascertain the quirks and nuances of this indicator. Fine-tune your strategy and then try it out in real time. Your goal is not perfection, but consistency over time. Consistency will tilt the odds in your favour and lead to a successful trading experience.
Continue Learning

Forextraders' Broker of the Month
BlackBull Markets is a reliable and well-respected trading platform that provides its customers with high-quality access to a wide range of asset groups. The broker is headquartered in New Zealand which explains why it has flown under the radar for a few years but it is a great broker that is now building a global following. The BlackBull Markets site is intuitive and easy to use, making it an ideal choice for beginners.