The United States Dollar/Singapore Dollar currency pair (also referred to as USDSGD and USD/SGD) is not one of the most actively traded currency pairs. Still, given the USD’s importance and Singapore’s growing economy, it is one to watch. In this article, we will examine how USDSGD is performing.
USDSGD Key Stats
- 2021 high: 1.3749
- 2021 low: 1.3157
- YTD high: 1.4097
- YTD low: 1.3407
- YTD % change: +2.99%
USDSGD Forecast
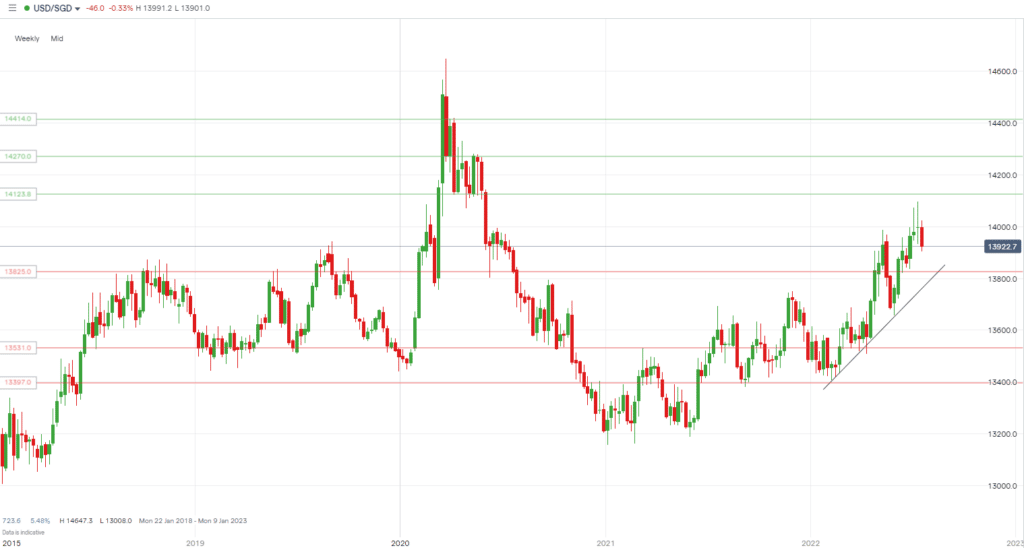
The current macroeconomic environment points to a continued move higher in the medium-term for the USDSGD. However, in the near term, we believe a pullback towards 1.3825 will occur, meeting the current bullish trendline before reversing and climbing higher once again. In the medium to long-term, our target is 1.4270.
USDSGD Fundamental Analysis
Fundamental analysis is a proven investment strategy for both long and short-term investments. When analysing the USDSGD, the major influences impacting the pair include actions from both the government and central banks. Any action from these central banks can include monetary action and changes to the interest rates. These influences can cause changes in its currency and impact the economy.
The USD is the most powerful currency in the world. This is because the country’s economy is extremely stable and strong, and it is the reserve currency for international trade and finance. There are various key data releases each month, including payroll data, GDP, retail sales, nonfarm payrolls, and much more. All of these have the potential to cause major price swings for the currency. As of now, inflation is spiraling, and the Fed announced its largest rate increase in 28 years. The Fed raised interest rates by three-quarters of a percentage point. The macroeconomic uncertainty globally has seen the dollar strengthen significantly.
The Singapore Dollar has been a favoured choice for offshore investors as it holds a growing financial center and stable housing prices. Its high rate of growth is achieved as it has one of the most business-friendly regulatory environments for entrepreneurs. It is a major trading hub, and its manufacturing and services sector remains one of its key growth drivers. Therefore, it is essential to assess Singapore’s current economic climate in order to develop a bearish or bullish bias.
USDSGD Technical Analysis
Support Levels:
- 1.3825
- 1.3531
- 1.3397
Resistance Levels:
- 1.4270
- 1.4414
- 1.4646
When it comes to support levels, we are firstly looking at 1.3825, which was recently tested several times. Price has yet to retrace back to this level, and it is one to keep an eye on. Next is 1.3551, which has been fairly strong historically and will be a key psychological area to watch out for. Finally, level 1.3397 is the lowest level of the three and is also historically and psychologically important. If the price were to fall this low over the next couple of months, we would be looking very strongly for a potential bounce.
The first resistance level we have our eyes on is 1.4270, which we believe will be tested over the next few months. Next would likely be 1.4414. This level has a history of strong price reaction, and we suggest traders take notice if the price climbs to that area. Finally, level 1.4646 is the pair’s highest point since 2009. It may be an area for bullish traders to take profits and, therefore, may lead to a bounce-back in price.
Trade USDSGD with our top brokers
| Broker | Features | Regulator | Platforms | Next Step | |
|---|---|---|---|---|---|
|
73% of retail C... |
|
FSA SC | MT4, MT5 | ||
 Your capital is at risk
Founded: 2014 Your capital is at risk
Founded: 2014 |
|
FSPR | MT4 | ||
 Your capital is at risk
Founded: 2006 Your capital is at risk
Founded: 2006Europe* CFDs ar... |
|
ASIC, FSA, FSB, MiFID | MetaTrader4, Sirix, AvaOptions, AvaTrader, Mirror Trader | ||
|
Between 74-89 % of retail investor accounts lose money when trading CFDs |
|
ASIC, FCA | MetaTrader 4, MetaTrader 5, cTrader | ||
|
77 % of retail investor accounts lose money when trading CFDs with this provider. You should consider whether you understand how CFDs work, and whether you can afford to take the high risk of losing your money. |
|
ASIC, CySEC, FCA | eToro Platform | ||
|
|
|
ASIC, CySEC, IFSC | MT4 Terminal, MT4 for Mac, Web Trader, iPhone/iPad Trader, Droid Trader, Mobile Trader, MT5 | ||
 Your capital is at risk
Founded: 2006 Your capital is at risk
Founded: 2006 |
|
CySEC, DFSA, FCA, FSB, SIA | MetaTrader4, MetaTrader5, cTrader, FxPro Edge (Beta) | ||

Forextraders' Broker of the Month
BlackBull Markets is a reliable and well-respected trading platform that provides its customers with high-quality access to a wide range of asset groups. The broker is headquartered in New Zealand which explains why it has flown under the radar for a few years but it is a great broker that is now building a global following. The BlackBull Markets site is intuitive and easy to use, making it an ideal choice for beginners.