The U.S. Dollar/South African Rand currency pair, also known as USDZAR and USD/ZAR, is one of the most traded in the world. Due to various social, political and economic factors it is also one of the most volatile. In this article we take a look at how this pair is performing.
USD/ZAR Key Stats
- 2021 high: 16.3643
- 2021 low: 13.3713
- YTD high: 16.3248
- YTD low: 14.4011
- YTD % change: -1.21%
USDZAR Forecast
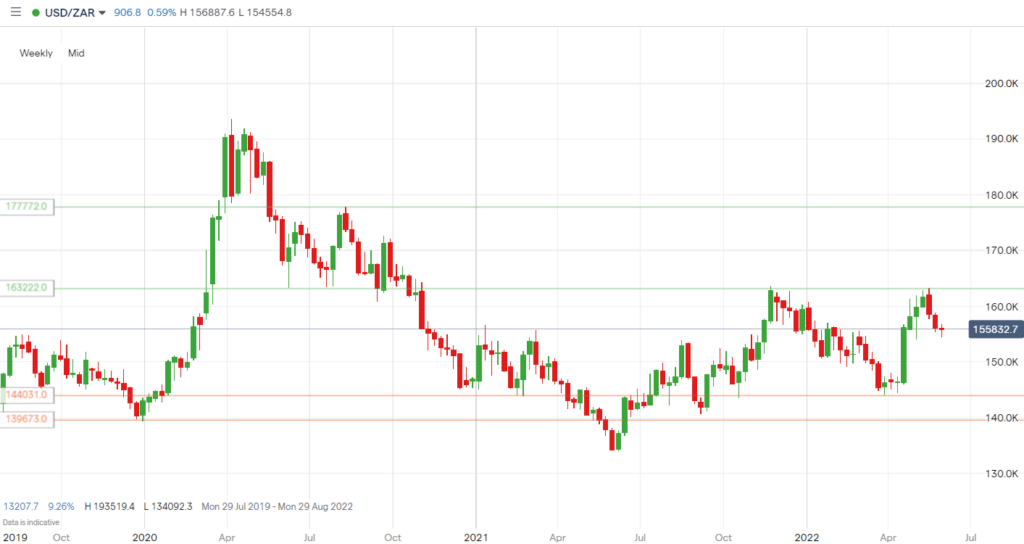
Based on a daily chart, and given the current uncertain market conditions (explained in further detail below), we expect the U.S Dollar/South African Rand pair to continue higher over the next year. Price has approached the key level between 16.3222 and 16.3643 twice, both times being rejected, but we expect another attempt and an eventual move above. Once we get that break, our next target is the level around 17.1480, and then, beyond that, we will look towards 17.7772.
USDZAR Fundamental Analysis
While interest rates will always be a key mover of currency pairs, one of the primary relationships between USD and ZAR is the fact that gold is traded almost exclusively in dollars. With gold being traded primarily in dollars, it means that usually, when the price of the USD rises, gold will slide, although it is not perfect (1-for-1), and there will be occasions where the correlation lessens.
Since South Africa is one of the world’s largest producers and a prominent exporter of the yellow metal, the South African Rand price strongly correlates with gold prices. As a result, the USD/ZAR is often inversely correlated to gold. So, when gold rises, the USD/ZAR will fall, and when gold falls, the USD/ZAR will increase, but as mentioned above, there will be times when the correlation weakens.
Another macroeconomic factor to look out for when trading the currency pair is China’s political and economic climate, due to it being the top destination for South African exports. For example, if the Chinese economy declines, they are likely to reduce the amount of goods they purchase from South Africa and other countries.
Global economic and political uncertainty should also be watched closely. With the South African rand being a high beta currency and the dollar a safe haven, any economic worries will see the price move in the dollar’s favour.
USDZAR Technical Analysis:
Key Support Levels:
- 14.7904
- 14.4031
- 13.9673
Key Resistance Levels:
- 16.3222
- 16.7329
- 17.1480
- 17.7772
Looking at the U.S. Dollar/South African Rand on a weekly timeframe, we can see the critical resistance level around 16.3222 we mentioned in our forecast above. We expect an eventual break of this level which will then turn into support. A key support level to watch for below the current price is around 14.7904 and another just below that at around the 14.4031 mark, with the price hovering just above that level in April.
With our current, long-term expectation of a move higher, key resistance levels include 16.7329, 17.1480, and 17.7772.
Trade USDZAR with our top brokers
| Broker | Features | Regulator | Platforms | Next Step | |
|---|---|---|---|---|---|
|
73% of retail C... |
|
FSA SC | MT4, MT5 | ||
 Your capital is at risk
Founded: 2014 Your capital is at risk
Founded: 2014 |
|
FSPR | MT4 | ||
 Your capital is at risk
Founded: 2006 Your capital is at risk
Founded: 2006Europe* CFDs ar... |
|
ASIC, FSA, FSB, MiFID | MetaTrader4, Sirix, AvaOptions, AvaTrader, Mirror Trader | ||
|
Between 74-89 % of retail investor accounts lose money when trading CFDs |
|
ASIC, FCA | MetaTrader 4, MetaTrader 5, cTrader | ||
|
77 % of retail investor accounts lose money when trading CFDs with this provider. You should consider whether you understand how CFDs work, and whether you can afford to take the high risk of losing your money. |
|
ASIC, CySEC, FCA | eToro Platform | ||
|
|
|
ASIC, CySEC, IFSC | MT4 Terminal, MT4 for Mac, Web Trader, iPhone/iPad Trader, Droid Trader, Mobile Trader, MT5 | ||
 Your capital is at risk
Founded: 2006 Your capital is at risk
Founded: 2006 |
|
CySEC, DFSA, FCA, FSB, SIA | MetaTrader4, MetaTrader5, cTrader, FxPro Edge (Beta) | ||

Forextraders' Broker of the Month
BlackBull Markets is a reliable and well-respected trading platform that provides its customers with high-quality access to a wide range of asset groups. The broker is headquartered in New Zealand which explains why it has flown under the radar for a few years but it is a great broker that is now building a global following. The BlackBull Markets site is intuitive and easy to use, making it an ideal choice for beginners.