Predicting when a trend will reverse is often said to be pure folly. What is needed is an effective technical trading technique that increases the probability of a reversal significantly enough to plan a strategy for it. The world of candlestick patterns offers a multitude of reversal signals, which when combined with other technical support can yield above-average results.
One of these highly probable patterns is known as the bullish kicking candlestick pattern. It may occur at the end of a long bearish trend or signify a continuation of an existing bullish trend after a predictable pullback. This pattern, however, is rare. It requires the appearance of a ‘gap’, which can happen after a significant event or announcement, and it is much more prevalent in the trading of equities rather than forex. Forex volumes tend to prevent any gaps from occurring.
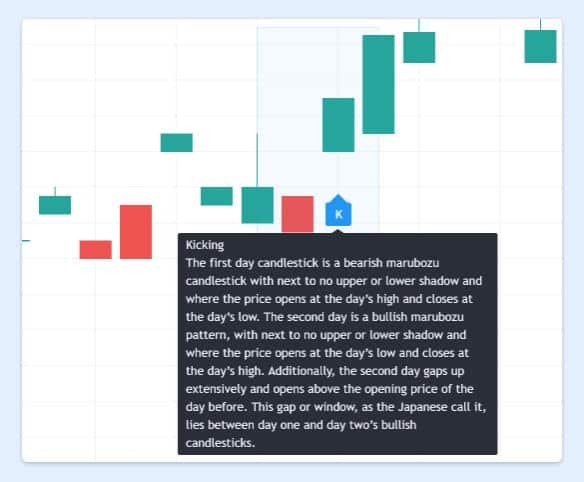
The depiction of a bullish kicking pattern in the graphic below is an ideal case taken from the stock market, but in order to take advantage of this reversal signal in the foreign exchange market, a trader must make a few adjustments. Typically, Marubozu patterns are also present. This shape in its purest form is a solid block with no wicks, but once again, Marubozos are very rare in the forex arena. When you see them in forex, they may have a ‘shaved head’ on the top or bottom (Marubozo roughly translates to ‘shaved head’), and a wick on either side.
Source: Tradingview.com
Appearing in Japanese rice futures markets in the 1700s, candlestick trading techniques, espoused by a trader known as the ‘God of Markets’, quickly took hold as a formidable tool for trading. It took a few centuries to reach the West, but today, candlesticks proliferate every trading platform around the globe, and their popularity now exceeds all other forms. Bar and line charts may still be available on MT4, MT5 and other proprietary platforms, but the usefulness of these little candlestick shapes have appealed to beginners and veterans alike.
The bullish kicking candlestick pattern, presented in its purest form in the above depiction, involves two individual candles. One is a downtrend-coloured red, while its green companion initiates an uptrend. The first candle must also resemble a Marubozu, while the second one ‘gaps’ up in price, exceeding the previous close and closing well above the previous open. This ‘gap’ gives the shape its ‘kicking’ name. In forex, you will need to view both candles as if there were Marubozus to see the alert. It is rare, but it is a reliable reversal signal.
To be effective in today’s topsy-turvy foreign exchange market, it is a must for a trader to have a basic understanding of the more important candlestick patterns and what information they entail about market conditions. It is a certainty that professional and veteran traders are fully aware of their import and that they act swiftly when the high-probability patterns reveal themselves. It does not take an inordinate amount of time to learn about candlesticks.
In the sections below, we will discuss the bullish kicking candlestick pattern. You will learn how to identify this pattern, the insights it provides about market psychology, and how to add the bullish kicking trading strategy within your daily trading routine. Finally, we also have a list of the very best forex brokers to use whenever you wish to employ candlestick strategies.
What Is the Bullish Kicking Candlestick Forex Pattern?
Before we look at a forex example of a bullish kicking pattern, we must discuss the Marubozu shape. It is a unique form, which opens at a specific value, slowly varies in price, and then closes, thereby forming a box. You may find this shape more prevalent in lightly traded equity shares, but in the high-volume forex arena, it is extremely rare. One accommodation in forex trading is that there are two other Marubozu forms. Besides the ‘full’ one, a modified Marubozu may have next to no wick on one end and the same for the other end.
Even with these clarifications, two modified Marubozus in succession are still a rare event, but when it does happen, it is a very strong reversal signal, which institutional traders will not ignore. For the bullish kicking candlestick pattern to appear, we need one more modification, and that is to visually draw boxes to form a full body about the existing body and small wicks. Such a modification will enable a ‘gap’ to be seen between the forms. This is a rare event in forex, unless after a weekend or after an unusual economic announcement when trading may be halted.
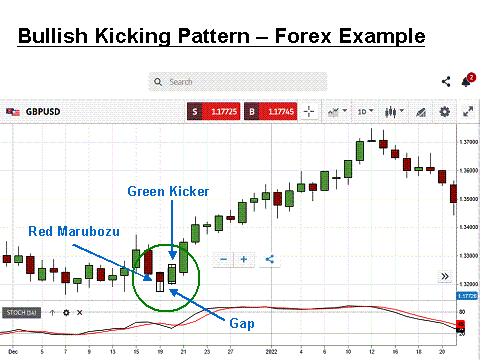
When this pair of modified Marubozus accompanies the end of a downtrend, the initial candle will be red, and the second one, the kicker, must be green, with a noticeable gap between or within the extended bodies of the Marubozus. For illustrative purposes, let’s review a daily chart for the GBP/USD currency pair to see how this pattern plays out in real-time:
Source: eToro
This chart, courtesy of eToro, has been annotated to point out the various characteristics of the bullish kicking pattern in the forex market. The ‘modified boxes’ are necessary due to volume considerations, but they may not be needed for more exotic and minor pairs, where limited liquidity might be more accommodating.
The bearish red Marubozu follows a downtrend, but its body size connotes weakening momentum. The bullish green Marubozu closes sharply upward, such that its body is significantly above its predecessor, creating the necessary ‘gap’. This second candle kicker is the start of a strong upward trend that lasts for 18 trading periods.
A bearish kicking pattern also exists. As you might expect, its characteristics are the exact opposite of the bullish variety and hints at a potential reversal of an uptrend. When either form appears, it is a very rare occurrence. However, it is also a highly reliable reversal signal that traders recognise, especially both professional and veteran traders, who will quickly react to advantage. The retail forex trader would be wise to react quickly, and then jump on the trend to come.
What Does the Bullish Kicking Candlestick Forex Pattern Mean?
Candlestick bullish patterns forex recognition can become a formidable tool for discovering high-probability trading setups. Their interpretation can yield a wealth of information about market psychology and where prices might be headed. For the bullish kicking pattern, the first red Marubozu signifies a slowing of momentum in a downtrend and a bit of uncertainty. Buyers and sellers slow down their pace in order for this unique shape to eventuate.
A single Marubozu, however, only signals indecision, but when paired with a ‘gapping-up’ green Marubozu, it is a signal to go long and to go quickly. Professional traders may already be filling large buy orders, the reason for the sudden gap, and there is little time to jump on board this train. In the case of the above graphic, the reversal was very strong, creating a long-lasting upward trend over three weeks. Its rareness and high probability for success is what drives the quick reversal. Quick recognition is necessary or you might be trampled over by the volatile upswing.
How to Trade the Bullish Kicking Candlestick Forex Pattern
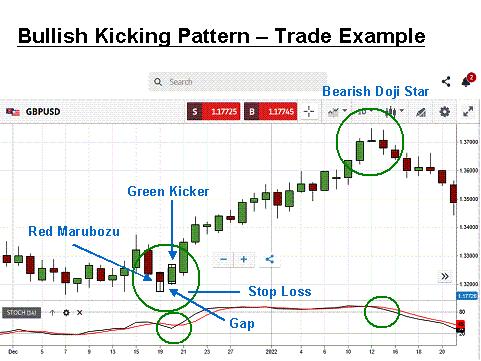
Let’s now expand upon our previous chart to demonstrate how easily the bullish kicking pattern can increase your odds for a winning trade. Here is a repeat of the above chart with a few more annotations:
Source: eToro
Candlestick patterns are not meant to be perfect, but they do give you an edge when trading. This edge can be magnified with the use of another complementary indicator. We have chosen the stochastic indicator in this GBP/USD example, but you may prefer another one. The kicking gap and the stochastic crossover are enough of a strong signal for going long on the pound.
As for closing your position, the bearish doji star, combined with an overbought stochastic crossover, is a formidable signal to take your profit. In this case, the bullish kicker telegraphed a very strong reversal. The uptrend extended for 17 more trading periods and would have yielded a gain in excess of 400 pips, a very good trade indeed.
Conclusion
The quickest way to improve your competency as a forex trader is to invest a few hours on candlestick pattern recognition, especially when it pertains to forex charts. It can be both an offensive and defensive weapon in your trading arsenal. After developing a familiarity of the basic shapes, concentrate on reversal and continuation formations that often appear in a series of candles.
The bullish kicking candlestick is just one of these reversal patterns that offer a high probability of success. Practice finding the modified Marubozus of this candlestick formation on historical charts, incorporate it in your trading plan, and then gain an edge in your future trades.
Trade Candlestick Patterns with Top Forex Brokers
| Broker | Features | Regulator | Platforms | Next Step | |
|---|---|---|---|---|---|
|
73% of retail C... |
|
FSA SC | MT4, MT5 | ||
 Your capital is at risk
Founded: 2014 Your capital is at risk
Founded: 2014 |
|
FSPR | MT4 | ||
 Your capital is at risk
Founded: 2006 Your capital is at risk
Founded: 2006Europe* CFDs ar... |
|
ASIC, FSA, FSB, MiFID | MetaTrader4, Sirix, AvaOptions, AvaTrader, Mirror Trader | ||
|
Between 74-89 % of retail investor accounts lose money when trading CFDs |
|
ASIC, FCA | MetaTrader 4, MetaTrader 5, cTrader | ||
|
77 % of retail investor accounts lose money when trading CFDs with this provider. You should consider whether you understand how CFDs work, and whether you can afford to take the high risk of losing your money. |
|
ASIC, CySEC, FCA | eToro Platform | ||
|
|
|
ASIC, CySEC, IFSC | MT4 Terminal, MT4 for Mac, Web Trader, iPhone/iPad Trader, Droid Trader, Mobile Trader, MT5 | ||
 Your capital is at risk
Founded: 2006 Your capital is at risk
Founded: 2006 |
|
CySEC, DFSA, FCA, FSB, SIA | MetaTrader4, MetaTrader5, cTrader, FxPro Edge (Beta) | ||

Forextraders' Broker of the Month
BlackBull Markets is a reliable and well-respected trading platform that provides its customers with high-quality access to a wide range of asset groups. The broker is headquartered in New Zealand which explains why it has flown under the radar for a few years but it is a great broker that is now building a global following. The BlackBull Markets site is intuitive and easy to use, making it an ideal choice for beginners.