Triple Exponential Moving Average, or TEMA, is a type of exponential moving average developed by Patrick Mulloy in 1994. One of the common problems of trading with EMAs or oscillators has always been the inevitable issue of lag encountered in trading decisions. The TEMA indicator was developed in order to deal with this problem.
Taking the moving average of the price smooths out short term fluctuations. But what happens if we were to take the EMA of the EMA to doubly smooth the market action? It is not hard to see that the new MA would create an even smoother picture of the price action, making it possible to identify trends and changes with a greater degree of clarity. The genius of the TEMA, however, is not in this idea of taking successive EMAs of EMAs, but in the lagging term added to the formula to deal with the issue of delayed signals.
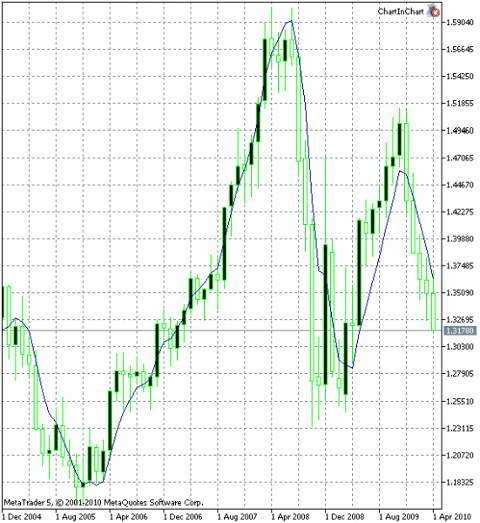
The above chart of monthly price movements in the EURUSD pair shows clearly the great power of TEMA (blue thin line). In the four reversals between August 2005 and April 2010, the TEMA indicator emits signals that suffer from very little lag. For example, the breakdown of the range pattern existing in the few months after August 2005 is signalled almost immediately by a coincident reversal of the indicator, with the strong thrust of the price movement matched by the clear trend established in the indicator. The same pattern is observed in the subsequent reversals in June 2008, and March 2009, although the latter two are coincident with severe volatility which reduce the significance of the alerts emitted by the indicator. Nonetheless there are clear opportunities where the price crosses above or below the TEMA, or where a line changes into a curve.
Calculation
The Triple exponential moving average is calculated according to the following formula:
TEMA=(3xEMA)-(3xEMAofEMA)+(EMAof EMAofEMA)
All that the trader needs to do in order to calculate the TEMA value is deciding the period of the indicator. For example, when we determine that the period will be 5 days, the indicator will calculate the EMA on raw price data. After that, it will regard the new EMA as if it was the new graph of the price action, and take a second EMA of it. This second value is also termed the double EMA or DEMA. Finally, a third EMA of the DEMA will be calculated and the values will be plugged into the above formula to reach at the value of the indicator. In the above paragraphs we mentioned that the TEMA deals with the lag issue of most exponential moving averages by the addition of a new term to the calculation. This new term is the double EMA (that is the EMA of the EMA) with the minus sign in the formula. By subtracting this term from the sum of the EMA and the triple EMA multiplied by three, the indicator is shifted to the right, while at the same time volatility is reduced as well.
Strategy
TEMA is a powerful tool and it can be utilized just as efficiently in a simple, monolithic approach to chase the trend in a long term context, as it can be used to trade shorter-term movements in a complex trading scheme. The indicator is a trend indicator. In light of its tendency to smooth out any short term distortions, it will be hard to use in a ranging market where short term fluctuations within the confines of the range pattern create the greatest trading opportunities.
In general, the longer the trend lasts, the easier it is to trade it with TEMA. In a longer lasting trend we can ignore periods of volatility, and the signals of the indicator are easier to use. Conversely, the more volatile the trend is, the less usable this indicator becomes. You can combine it with various oscillators to exploit periods of sharp fluctuations as entry/exit phases for the trade, and you can also use additional tools to separately evaluate volatility. A combination of the MACD modified with this indicator (where it replaces the ordinary EMAs used for smoothing the price) is especially popular among some traders.
Summary
The advantages of incorporating the Triple Exponential Moving Average into your strategy are numerous. It is a lot easier to identify trends with it, there is no lag problem, and the use of the indicator is no different than using any simple or exponential moving average. The disadvantages of the TEMA, on the other hand, are that it is only too quick to suggest a change in momentum, and that the clear and strong signals that it gives about the price action may not always coincide with an equally simple and easy-to-trade market configuration.
The main purpose of using the TEMA indicator is filtering out volatility. When the trader wishes to focus on a long lasting, strong and credible trend with a simple trend following strategy TEMA is a priceless tool, and it is frequently possible to depend on it alone for the generation of actionable trade signals. But in cases where volatility is a significant problem, TEMA may not be a great choice, especially if it is not used in conjunction with Bollinger Bands, or the Standard Deviation tool to analyze the risk posed by a highly volatile market.
Further reading:
Learn more about forex oscillators.
Learn about the Bollinger Bands indicator.

Forextraders' Broker of the Month
BlackBull Markets is a reliable and well-respected trading platform that provides its customers with high-quality access to a wide range of asset groups. The broker is headquartered in New Zealand which explains why it has flown under the radar for a few years but it is a great broker that is now building a global following. The BlackBull Markets site is intuitive and easy to use, making it an ideal choice for beginners.