

Technical analysis plays a key role in most trading strategies and traders rely heavily on various techniques to make informed investment decisions. Chart patterns, such as the flag pattern, are one of the first technical analysis techniques that beginner traders learn about and for good reason.
These patterns appear repeatedly in all markets and timeframes and are known by many names. Knowing what these patterns look like and how to trade them is an important skill set that both beginner and professional traders use.
In this article, we will be taking an in-depth look at one such chart pattern – the flag pattern – and how traders read this pattern to enter trades. The flag pattern is one of the most commonly occurring patterns in trading and is relatively easy to identify.
The Flag Pattern Explained
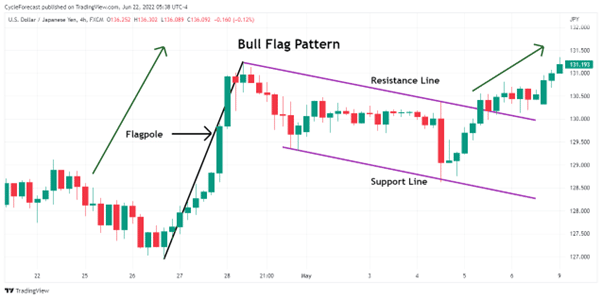
Image for illustration purposes only
The flag pattern is used to spot the potential continuation of a prior trend from a point where price has moved against it. If the trend were to return, the price gain might be swift, making it possible for traders to time their trades better when they notice the pattern.
Flag patterns develop when price briefly pauses and moves against the direction of the prior trend, whether the trend is bullish or bearish. Two parallel lines (purple lines) that form the ‘flag’ portion of the bull flag pattern are seen in the chart image above. These lines serve as support and resistance during the countertrend move.
The upward move in price preceding the flag formation is called a flagpole. The entire pattern formation, therefore, resembles a flag on a pole, hence the name of the pattern.
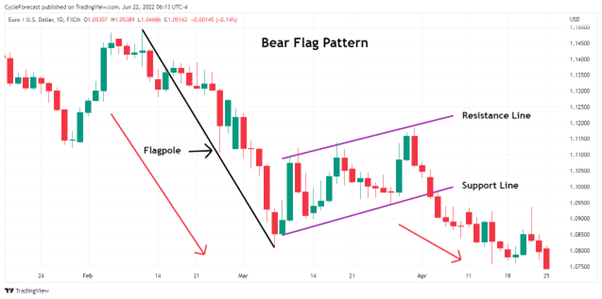
Image for illustration purposes only
Our second chart example above shows a bear flag pattern that formed during a strong downtrend. Here also, price moved against the preceding trend direction, but bounced up and down between the two parallel support and resistance lines before the consolidation phase ended and the downtrend continued.
Related Articles
How to Draw the Flag Pattern
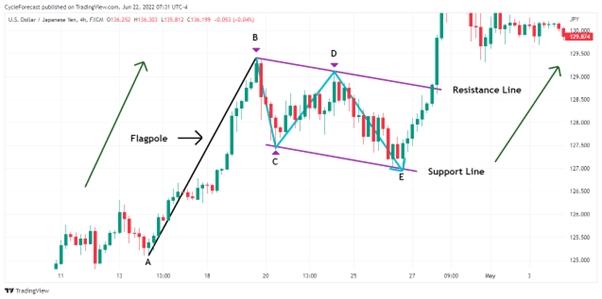
Image for illustration purposes only
Now that we have discussed the appearance of a flag pattern, forex traders will find it useful if we talk about when and how to draw the parallel support and resistance lines. Later, we will discuss how traders typically use this pattern to enter trades.
Using the bullish flag pattern example above, price trended upward from the point labelled A to the start of the countertrend move labelled B. Price then moved lower, found support at point C and moved higher again.
If we were watching the price action around the time that point C found support, then there would have been no early sign that a bull flag pattern was underway.
However, the first actual indication that a flag pattern was developing occurred as soon as price failed to reach a new high at point D and turned lower again. It is at this stage that traders will anticipate a break of point C in a ‘zigzag’ type of formation (light blue line between parallel lines) and get ready to draw their parallel support and resistance lines.
The resistance line was drawn by connecting the high at point B with the lower high at point D and extending the line to the right. To draw the support line, simply draw another line parallel to the resistance line and connect it to point C.
Note that there were no instances where price created this zigzag type of formation during the strong upward move from point A to B. Waiting for this zigzag price structure to appear will be the first step before you proceed to draw your parallel support and resistance lines.
How to Trade the Flag Pattern
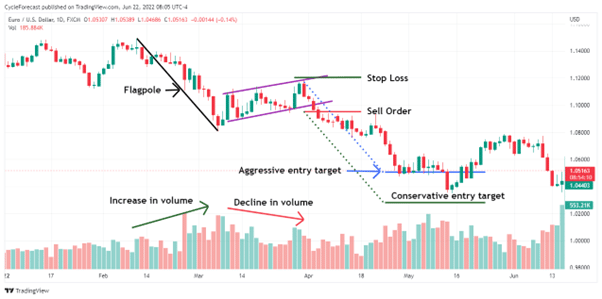
Image for illustration purposes only
What follows is a simple trading strategy that includes a volume indicator to help spot high probability flag pattern setups. Traders who follow this pattern will often decide between an aggressive or more conservative entry method.
The trade entry examples above, following a bear flag pattern, show both methods. Aggressive traders might decide to enter a short position as close as possible to the upper resistance line with a tight stop loss. A target for this entry method can be determined by measuring the height of the flagpole and projecting it lower from the entry price (dotted blue angled line and horizontal line).
Aggressive trade entries are often riskier, as is the case with this example, because you will not know for sure that the flag pattern has ended, unless you are relying on additional analysis methods to confirm that the flag pattern might be nearing an end.
Therefore, we included the volume indicator on the lower panel of the chart. During a trending phase, volume will typically increase, as was the case with the example above, but during the flag phase of the pattern, volume slowly decreased.
This was an indication that the flag pattern was nearing an end. The declining volume simply acted as an additional confirmation method that aggressive traders would look out for before they start planning their entries.
Traders who follow the conservative entry method will first wait for price to break and close below the lower support line and then enter a position. With this method, the height of the flagpole can be used again and projected lower from the entry price to find a target level (dotted green angled line and horizontal line). A stop loss can be placed above the preceding high that formed at the upper resistance line.
Although the conservative method relies on confirmation from price breaking out of the flag pattern first, traders who follow this approach will often also rely on an additional confirmation signal from an indicator, such as the volume indicator.
Flag Pattern Trading Examples
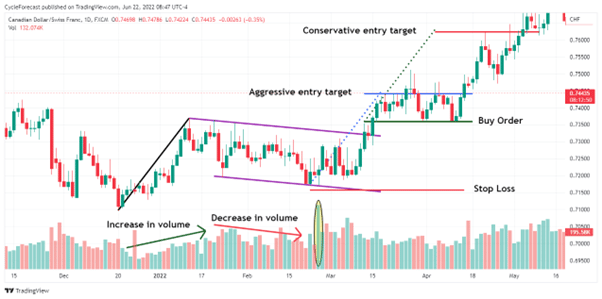
Image for illustration purposes only
Our first trade example shows a bull flag pattern that formed on a daily timeframe. Note how volume increased prior to the flag formation but decreased while price was trading between the upper resistance and lower support lines.
This is a good example of how trading volume can assist a trader in deciding whether a trend continuation will occur after the bull flag pattern ends. Another clue that the consolidation phase was nearing an end appeared when price moved higher from the lower support line with a huge increase in buying volume (yellow oval on volume panel), raising the probability that the consolidation phase has ended.
In this trade example, both the aggressive and conservative entry methods reached their targets in quick succession.
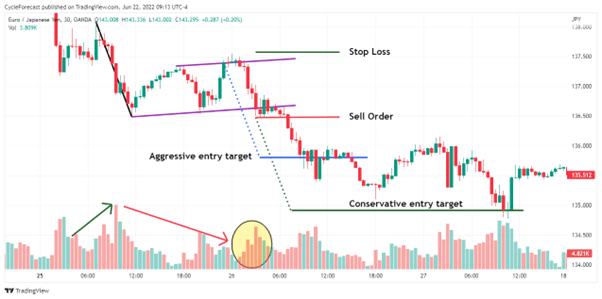
Image for illustration purposes only
Our final trade example shows a bear flag pattern but this time on a 30-minute timeframe. Proving that this pattern can appear on any timeframe which makes it a great pattern to follow regardless of your trading style.
Here too, volume increased prior to the formation of the flag formation but decreased while price was trading between the resistance and support lines. Even on the 30-minute timeframe, volume started to increase again soon after price reached the upper resistance line – signalling that the bearish trend has resumed.
Conclusion
This article explored a very popular chart pattern that many traders, regardless of their experience levels include in their trading plans. Not only is the flag pattern easy to identify but the breakout that follows the completion of this pattern often leads to a strong trend continuation move that can reach a trader’s targets in quick succession.
The trade examples shown previously, included the volume indicator to help determine whether the flag patterns might lead to high probability setups. As with most trading strategies, it is often a good idea to combine various analytical methods to make better trading decisions.
Other indicators like the MACD-indicator can also be used to trade the flag pattern and might be of interest to you if you were to include the flag pattern in your own trading strategy.

Forextraders' Broker of the Month
BlackBull Markets is a reliable and well-respected trading platform that provides its customers with high-quality access to a wide range of asset groups. The broker is headquartered in New Zealand which explains why it has flown under the radar for a few years but it is a great broker that is now building a global following. The BlackBull Markets site is intuitive and easy to use, making it an ideal choice for beginners.