
FOCUS ON: Continued Price Consolidation
- A wide range of medium-level economic data will be released this week.
- Price consolidation patterns could continue to be the dominant theme for most markets.
- The US holiday on Monday also points towards markets waiting to make their next significant move.
Trading Ideas
Based on our technical analysis, we created this Weekly Tips section to share possible trade entry and exit points. We also have other methods to validate our trades which we can’t publicly share, that help to increase their success. All our trades include entry and at least one target price. Stop losses are applied at the reader’s discretion. Our strategies typically trade with a wide stop loss, and risk is further mitigated by trading in small sizes.
Instrument | Price | Hourly | Daily |
GBP/USD | 1.2037 | Buy | Strong Sell |
EUR/USD | 1.0695 | Strong Buy | Neutral |
USD/JPY | 134.15 | Neutral | Strong Buy |
S&P 500 | 4,072 | Sell | Neutral |
NASDAQ 100 | 12,333 | Strong Sell | Neutral |
FTSE100 | 8,007 | Strong Buy | Strong Buy |
Gold | 1,845 | Strong Buy | Neutral |
Crude Oil WTI | 77.34 | Buy | Neutral |
Bitcoin | 24,380 | Buy | Strong Buy |
Ethereum | 1,502 | Buy | Sell |
UTC: 09:58
US Dollar Basket Index (DXY)
The US Presidents’ Day holiday on Monday 20th, February means the trading week will be shortened, but a diverse range of data points will hit the markets from Tuesday. Eurozone inflation and sentiment reports accompany interest rate updates from Australia’s RBA, and the all-important US FOMC minutes are released on Wednesday.
Technical indicators include a range of neutral readings across various asset groups. That reflects the markets having formed largely sideways trading patterns. EURUSD, GBPUSD, the S&P 500 and NASDAQ 100 indices, and cryptocurrency Ethereum have all posted week-on-week price changes within a tight 0.35% range.
Further price consolidation can’t be discounted. That will create opportunities for range-trading strategies, but there is also the ever-present chance of a catalyst leading to a more significant change in momentum.
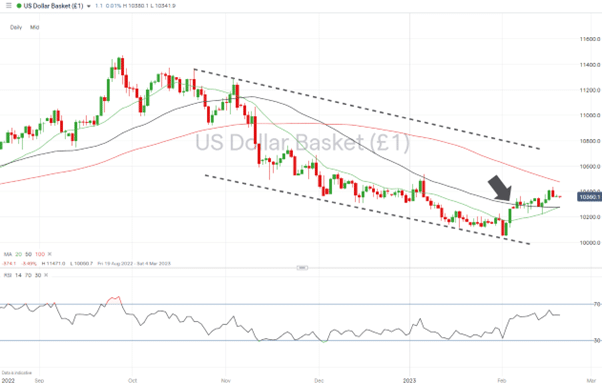
US Dollar Basket Chart – Daily Price Chart – Above 50 SMA
Source: IG
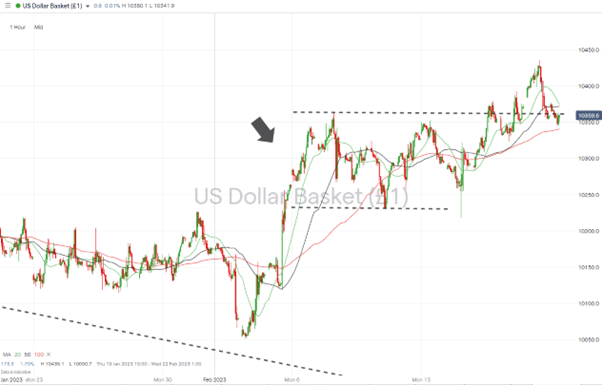
US Dollar Basket Chart – Hourly Price Chart
Source: IG
Short positions
- Entry Level 1: 103.63 – Price high of Tuesday 7th February 2023. Formed the upper end of last week’s sideways trading channel, and a break back within that range would see it return to act as a resistance price level.
- Price Target 1: 102.31 – Price low of the week beginning 9th February. Also, the region of the 20 and 50 SMA’s on the Daily Price Chart are currently at 102.78 and 102.75, respectively.
- Price Target 2: 100.00 – In extension, parity price level and region of supporting trendline of the downward price channel.
- Stop Loss: > 105.37 – Year-to-date price high printed on 6th January 2023.
Long positions
- Entry Level 1: 102.78 – The convergence of the 20 and 50 SMAs on the Daily Price Chart points to the region 102.75 – 102.78 being one where considerable price support could be found.
- Price Target 1: 104.36 – Price high of the week of 17th February 2023. The 100 SMA on the Daily Price Chart is currently trading in the region of 104.75.
- Price Target 2: 105.37 – In extension, the year-to-date price high was recorded on 6th January 2023.
- Stop Loss: < 102.00 – Round number price level and price support/resistance level guided price between 12th January and 3rd February 2023.
GBPUSD
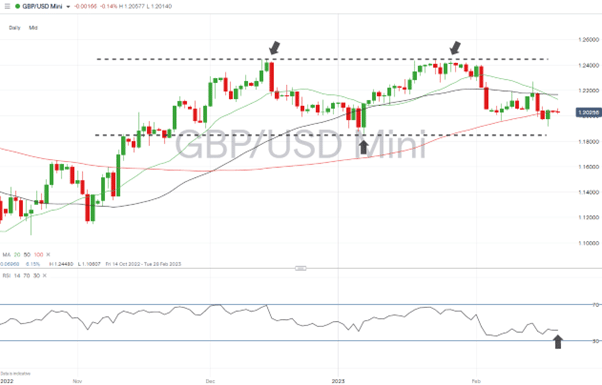
The potential double-top price pattern in GBPUSD relies on the price breaking the low 1.18413 level recorded on 6th January. With significant downward momentum failing to materialise, price action is forming a sideways channel within the 1.18413 and 1.24480 price levels.
The RSI on the Daily Price Chart is at 42.17, allowing the price the room to move significantly in either direction before becoming ‘overbought’ or ‘oversold’ in that timeframe.
Daily Price Chart – GBPUSD Chart – Daily Price Chart
Source: IG
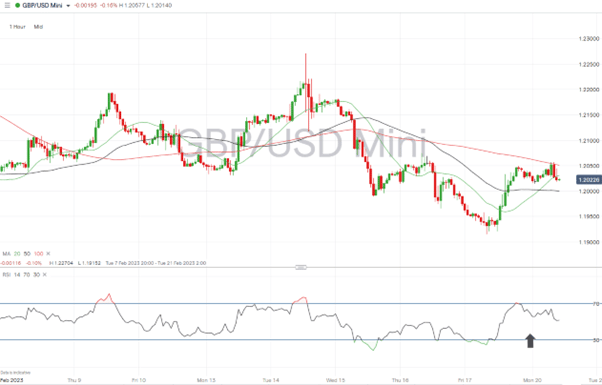
GBPUSD Chart – Hourly Price Chart
Source: IG
Short positions
- Entry Level 1: 1.21283 – Region of the 20 SMA on the Daily Price Chart.
- Price Target 1: 1.20406 – The 100 SMA on the Daily Price Chart can be expected to offer price support in the region of 1.20406. It currently sits above the psychologically important 1.20 price level.
- Price Target 2: 1.18413 – Price low of 6th January and pivot point of the potential double-top price pattern.
- Stop Loss: > 1.21671 – Region of the 50 SMA on the Daily Price Chart.
Long positions
- Entry Level 1: 1.20407 – Price has traded above the 100 SMA on the Daily Price Chart since 10th November 2022. With that metric currently being tested, there is a chance of a rebound in price should it hold.
- Price Target 1: 1.21671 – Region of the 50 SMA on the Daily Price Chart.
- Price Target 2: 1.22156 – The 61.8% Fibonacci retracement price level formed by the price fall between 14th December 2022 and 6th January 2023.
- Price Target 3: 1.24480 – 2023 year-to-date price high recorded on 23rd January.
- Stop Loss: < 1.20 – ‘Round number’ support level.
EURUSD
Euro-based currency pairs could see an uptick in volatility this week due to a range of economic reports being released. German (Gfk) consumer confidence numbers are published on Monday 20th and Friday 24th, and crucial inflation data is released on Tuesday.
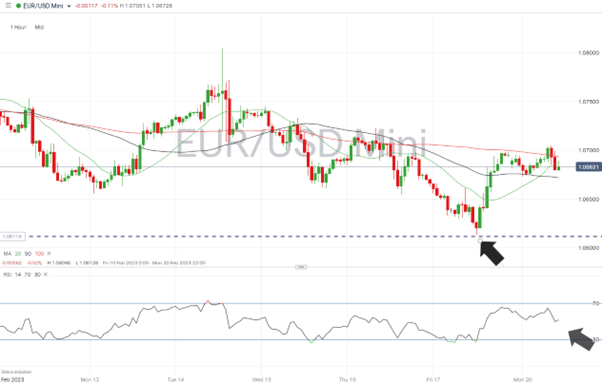
As with GBPUSD, the RSI on the Hourly and Daily Price Charts is trading mid-range, leaving room for a move in either direction.
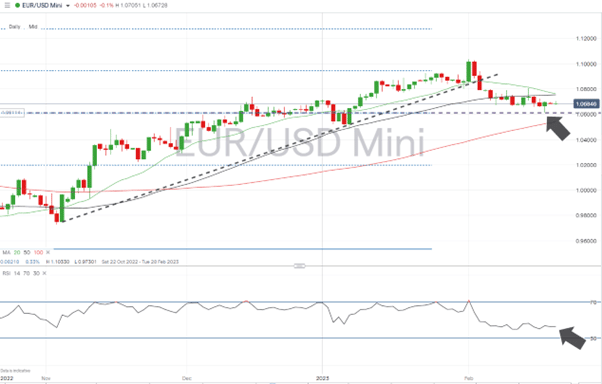
EURUSD Chart – Daily Price Chart – Trendline and SMA Break
Source: IG
EURUSD Chart – Hourly Price Chart
Source: IG
Short positions
- Entry Level 1: 1.07619 – Range-trading strategies could use the convergence of the 20 and 50 SMAs as an entry point for short positions. These metrics currently sit at 1.07619 and 107.532, respectively.
- Price Target 1: 1.6114 – 38.2% Fib retracement level of the EURUSD price fall between January 2021 and September 2022.
- Price Target 6: 1.05396 – Region of the 100 SMA on the Daily Price Chart.
- Stop Loss: > 1.10330 – Price high of 1st February marking failed test of the psychologically important 1.10 resistance level.
Long positions
- Entry Level 1: 1.06128 – Price low of 17th February. Sits just above the 38.2% Fib retracement support/resistance price level.
- Price Target 1: 1.07619 – Region of the 20 and 50 SMAs on the Daily Price Chart.
- Price Target 2: 1.09423 – In extension, the region of the 50% Fibonacci retracement of the downward price move seen between January 2021 and September 2022.
- Stop Loss: <1.05210 – Swing-low, year-to-date (closing) price level of 5th January 2023.
Indices
S&P 500
With the US earnings season almost completed, stock markets can be expected to focus more on macroeconomic data releases. The big news event for risk-on assets this week is the release of the minutes from the last meeting of the US Federal Reserve. Those are released on Wednesday, 22nd February.
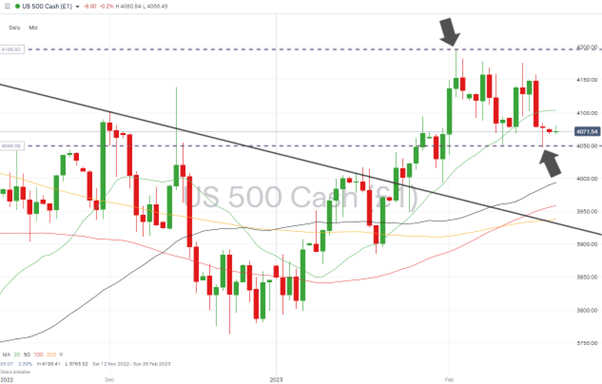
S&P 500 Chart – Daily Price Chart –Trendline Break Followed by Sideways Trading
Source: IG
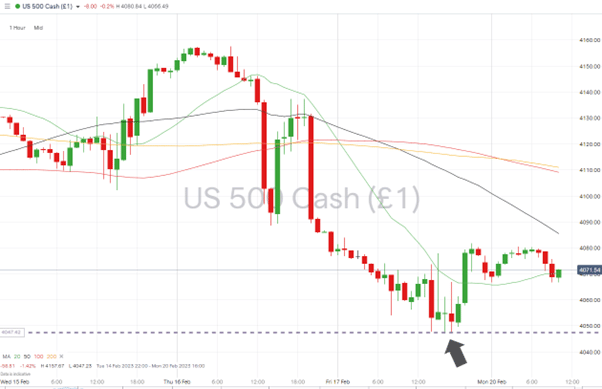
S&P 500 – Hourly Price Chart
Source: IG
Short positions
- Entry Level 1: 4,047 – Applying a momentum-based strategy and selling into price weakness causes a break of the support offered by the ‘weekly-low’ price recorded on Friday, 17th February.
- Price Target 1: 3,993 – Region of the 50 SMA on the Daily Price Chart.
- Price Target 2: 3,927 – Upper trendline of the downward price channel dating from January 2022. Also, the region of the 200 SMA on the Daily Price Chart (3938).
- Stop Loss: > 4,177 – Year-to-date high closing price recorded on 7th February 2023.
Long positions
- Entry Level 1: 4,047 – Using the price low of 17th February as a support level. An earlier test of this level took place on 10th February, and a rebound followed that move as high as 4175.
- Price Target 1: 4,103 – Region of the 20 SMA on the Daily Price Chart.
- Price Target 2: 4,195 – 2023 year-to-date price high recorded on 2nd February.
- Stop Loss: < 3,993 – Below the psychologically important 4,000 price level and region of the 50 SMA on the Daily Price Chart.
Crypto – Bitcoin & Ethereum
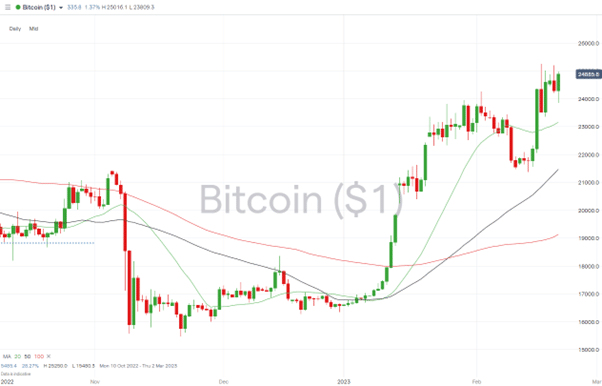
Two weeks of price consolidation have been followed by both major cryptos showing further strength. Bitcoin led the way by posting a +10% week-on-week gain. The 20 SMA on the Daily Price Chart is a crucial metric for both coins.
Bitcoin Price Chart – Daily Price Chart
Source: IG
Bitcoin Long positions
- Entry Level 1: 23,154 – Buying into short-term weakness, which takes the price into the region of the 20 SMA on the Daily Price Chart.
- Price Target 1: 25,250 – Year-to-date price high of 16th February.
- Price Target 2: 28,409 – 61.8% Fib retracement level of the upward price move in BTC recorded between February 2019 and November 2021.
- Stop Losses: < 20,000 – ‘Round number’ support level.
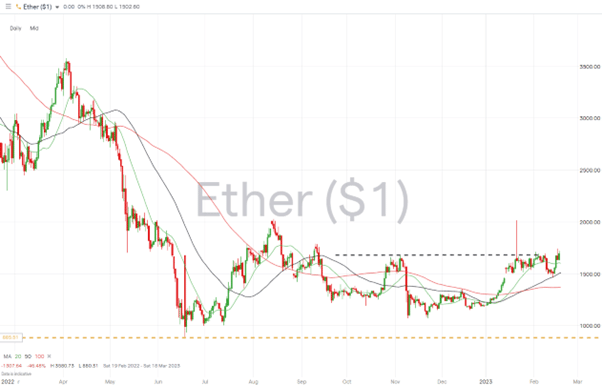
Ethereum
Ethereum Chart – Daily Price Chart
Source: IG
Ethereum Long positions
- Entry Level 1: 1,676 – The price high of 4th November 2022 has acted as resistance to the price of Ether, with the market repeatedly testing that price level but failing to close above it. Should a breakout be confirmed, buying into long positions could be considered part of a momentum-based strategy.
- Price Target 1: 2,000 – Psychologically important ‘round number’ resistance price level. Also, the region of the price high of 13th August 2022.
- Stop Losses: < 1,509 – Region of the 50 SMA on the Daily Price Chart
Risk Statement: Trading financial products carries a high risk to your capital, especially trading leverage products such as CFDs. They may not be suitable for everyone. Please make sure that you fully understand the risks. You should consider whether you can afford to take the risk of losing your money.

Forextraders' Broker of the Month
BlackBull Markets is a reliable and well-respected trading platform that provides its customers with high-quality access to a wide range of asset groups. The broker is headquartered in New Zealand which explains why it has flown under the radar for a few years but it is a great broker that is now building a global following. The BlackBull Markets site is intuitive and easy to use, making it an ideal choice for beginners.