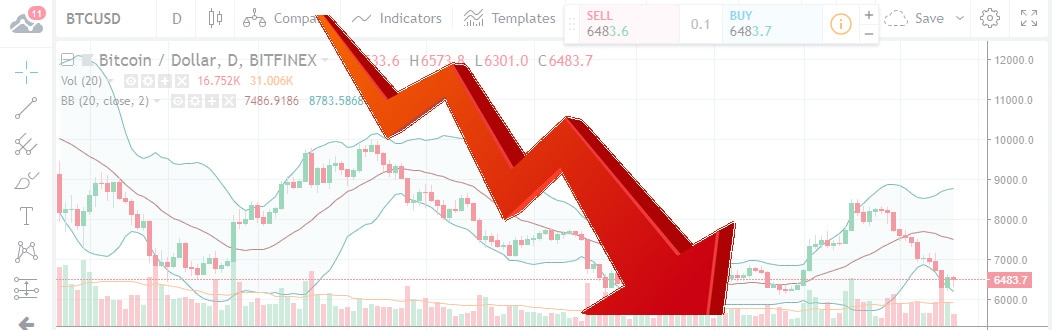
The price of the world’s top cryptocurrency has been slapped around lately by the bears, shedding almost all the value built up over its last rally to around $8.5k. Currently trading at $6.46k, BTC may have stopped bleeding for now…will it manage to hold on though…possibly turning this rout around into another rally back above the $8k mark? Let us see what technical analysis says…
According to technical analysis buffs, the fact that the price managed to break above the $6.5k mark yesterday (Thursday, August 9), meant that the bulls began fighting back and that the selloff was running out of steam. Still, despite that cautious optimism, the price more or less continued its slide today, though – as said in the intro above – it is now back in the neighborhood of $6.5k again.
The $6.5 support level was found to be significant in light of the most recent low BTC probed: before this minor rebound, it had sunk all the way to $6,138, its lowest price-level for the last 26 days.
The recent pullback began on August 1, and it’s lasted through all 10 trading days thus far, only showing some signs of slowing down today. Indeed, today’s sideway price-evolution was heralded by a Tweezer Bottom candlestick pattern yesterday, which dropped clues of a short-term trend reversal.
The growing trading volumes that accompanied this tiny glimmer of hope, added to its credibility.
Another technical factor that supports this short-term optimism is the MACD, which is now ticking upwards, for the first time since the current pullback began.
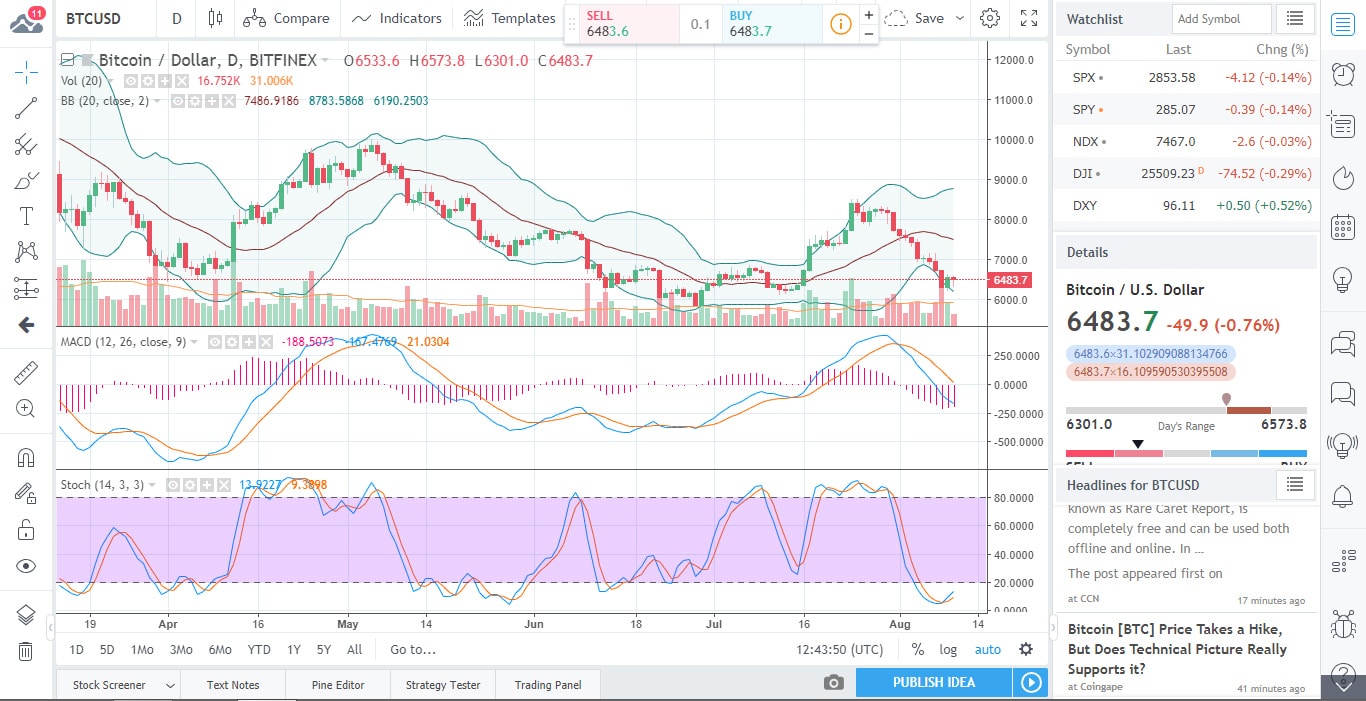
Taking a broader look over the technical picture does not yield much cause for such optimism though. The MAs (some 13 of them no less), are screaming SELL, with only the Hull Moving Average attempting to swim against the tide.
While much less categorical, the oscillators are pointing to SELL as well. More precisely, the Awesome, the Momentum and the MACD Level are…some 7 more are neutral and the Commodity Channel Index braves the tide, pointing to BUY.
To really neutralize the current bearish outlook and to tip the balance in the bulls’ favor, today’s close is of the essence. To achieve the above, the price needs to climb over the $6,628 mark, defined by the high of the previous day.
Closing below $6,240 would open the path to $5,755, which is the low of the month of June.
All this is nice and tidy, however, we still have major doubts about the overall validity of technical analysis when it comes to making short- and long-term crypto price predictions. We have been preaching from the very beginning that this type of approach does not lend itself well to these markets, and now we finally have some scientifically-backed legs to stand on in this regard.
According to a recent study by the NBER (National Bureau of Economic Research) Google Search is the most accurate and reliable predictor of upcoming cryptocurrency price-movements. One of the conclusions of the said exercise in statistical prowess is that the markets do not see the crypto asset class as being similar to traditional asset classes. As such, these assets (cryptos) do not respond to the same market factors other asset classes do.
The bottom line is that a standard deviation increase in “bitcoin” search volumes forecasts a small price-increase in the token in question, over the following weeks.
Do the fundamentals say anything this time around?
Other than the news that the SEC will have to decide for or against no fewer than 9 BTC EFT initiatives in the near future, there isn’t really anything of particular significance trending out there right now…

Forextraders' Broker of the Month
BlackBull Markets is a reliable and well-respected trading platform that provides its customers with high-quality access to a wide range of asset groups. The broker is headquartered in New Zealand which explains why it has flown under the radar for a few years but it is a great broker that is now building a global following. The BlackBull Markets site is intuitive and easy to use, making it an ideal choice for beginners.