Over the last 24 hours, Bitcoin bulls took a major hit and have been forced into a defensive stance. The price of the top cryptocurrency took a dip, hitting the $4.9k level at one point. It now looks like proper support may have been found at the $5k mark. Where to from here? Even though the bulls yielded ground, the overall mid-term setup remains a bullish one.
Currently trading at $5,063, the price of BTC not only managed to rebound to above $5k – a major psychological support level – it even scaled a technical milestone that may turn out to be a major factor further down the line.
That milestone is the $5,050 level. A 6-hour candle closed below it, turning up the heat on the bulls and putting them under pressure to scale that level before the end of the trading session. That is now behind us, although by not much more than a hair.
The $5,050 mark has been shaping up as a major resistance level on the 6-hour chart. If the price finds traction above it, the bulls will most likely prevail and further losses shall be pared.
A daily close below this level would leave the case open for dispute by the bears.
What about the daily chart though?
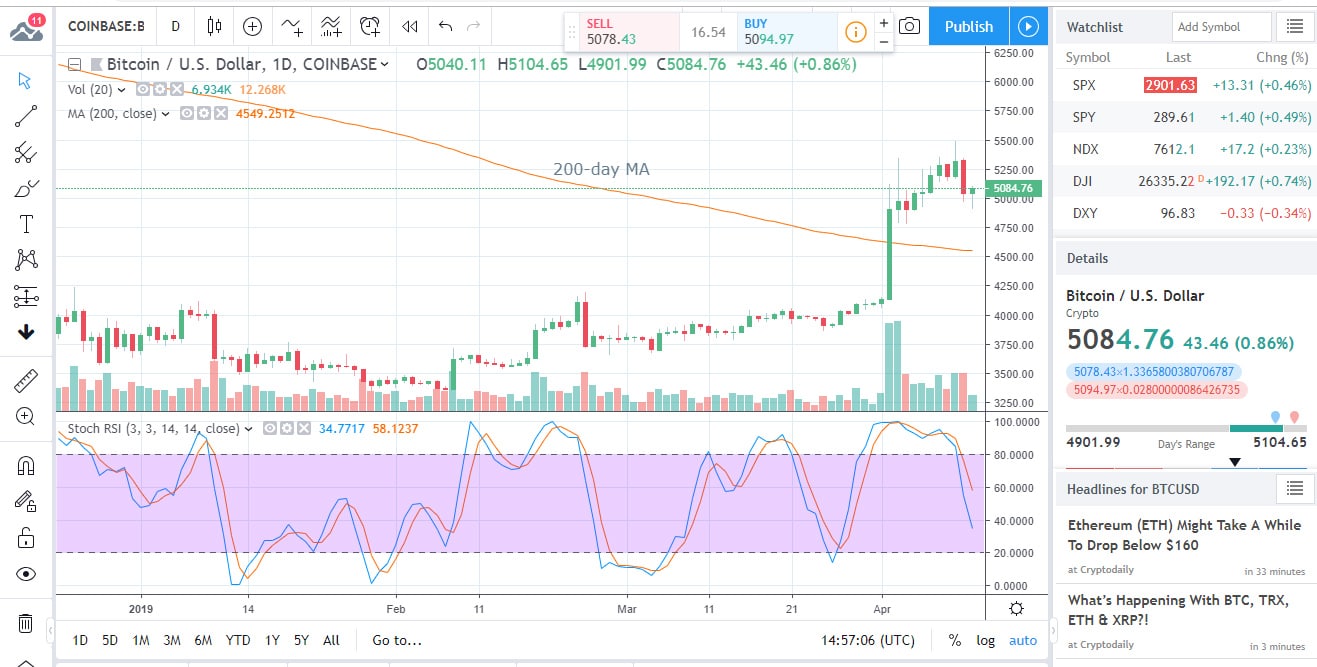
The critical support level to watch here is the $5,000 level. A close above that level would re-assert the dominance if the bulls. If the price drops below it however, further losses would come into the picture, all the way down to the Fibonacci retracement of $4,841.
The bearish volumes have not been particularly strong however, and on a low-key note, the daily RSI pulled back to below 70, suggesting that BTC is no longer overbought at this point.
Putting a bottom into the price action now would be a sort of double win for the bulls. It would stop the immediate bleeding on one hand, while creating a hidden bullish divergence on the other.
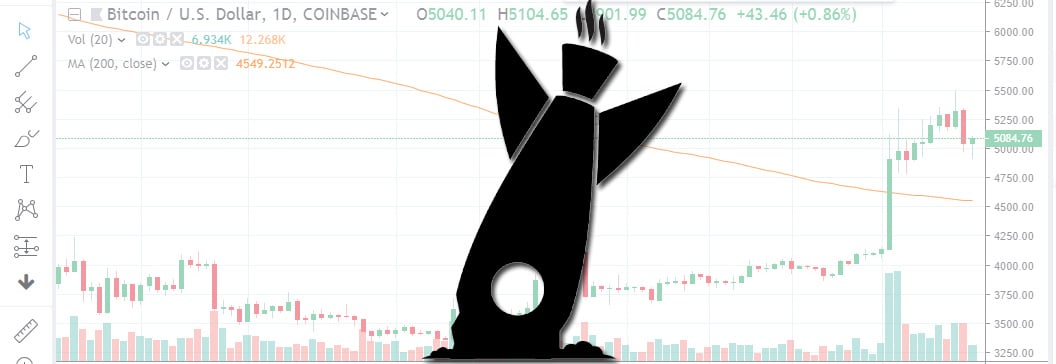
While further see-sawing may be in order over the short-term, the long-term outlook remains bullish as long as the price remains above the 200-day MA, currently sitting at $4,548.
This level can be considered the final defensive line for the bulls. Falling back past that would neutralize the recently materialized bullish outlook, returning us to the icy grip of the bear market.
To what do the fundamentals attribute this latest dip?
While some were quick to bill the retracement as a “purely technical” one, others have found various fundamentals-rooted explanations for it.
One theory says that the main factor behind the dip was the arrest of WikiLeaks founder Julian Assange. Those preaching this theory point to the liquidation of more than 4,000 BTC from WikiLeaks wallets, some hours prior to Assange’s actual arrest by British police.
While there certainly is some logic behind the theory and behind the timing of the series of sudden drops that landed us where we now are, the question remains: can 4,000 BTC really produce such a massive swing in the price? If it can – as some talking heads put it – think of what will happen when John McAfee gets arrested…
It is also true that save for the mentioned Assage-related turmoil, the news-flow has been relatively bland lately. Various crypto actors go about their business, increasing or cutting their fees, jettisoning some percentage of their workforce etc. There is nothing really that could/should move the BTC price needle in any significant manner.
Then again, this may be nothing more than a natural – and quite expected – correction in BTC’s slow but steady reversal of the bear market blues.

Forextraders' Broker of the Month
BlackBull Markets is a reliable and well-respected trading platform that provides its customers with high-quality access to a wide range of asset groups. The broker is headquartered in New Zealand which explains why it has flown under the radar for a few years but it is a great broker that is now building a global following. The BlackBull Markets site is intuitive and easy to use, making it an ideal choice for beginners.