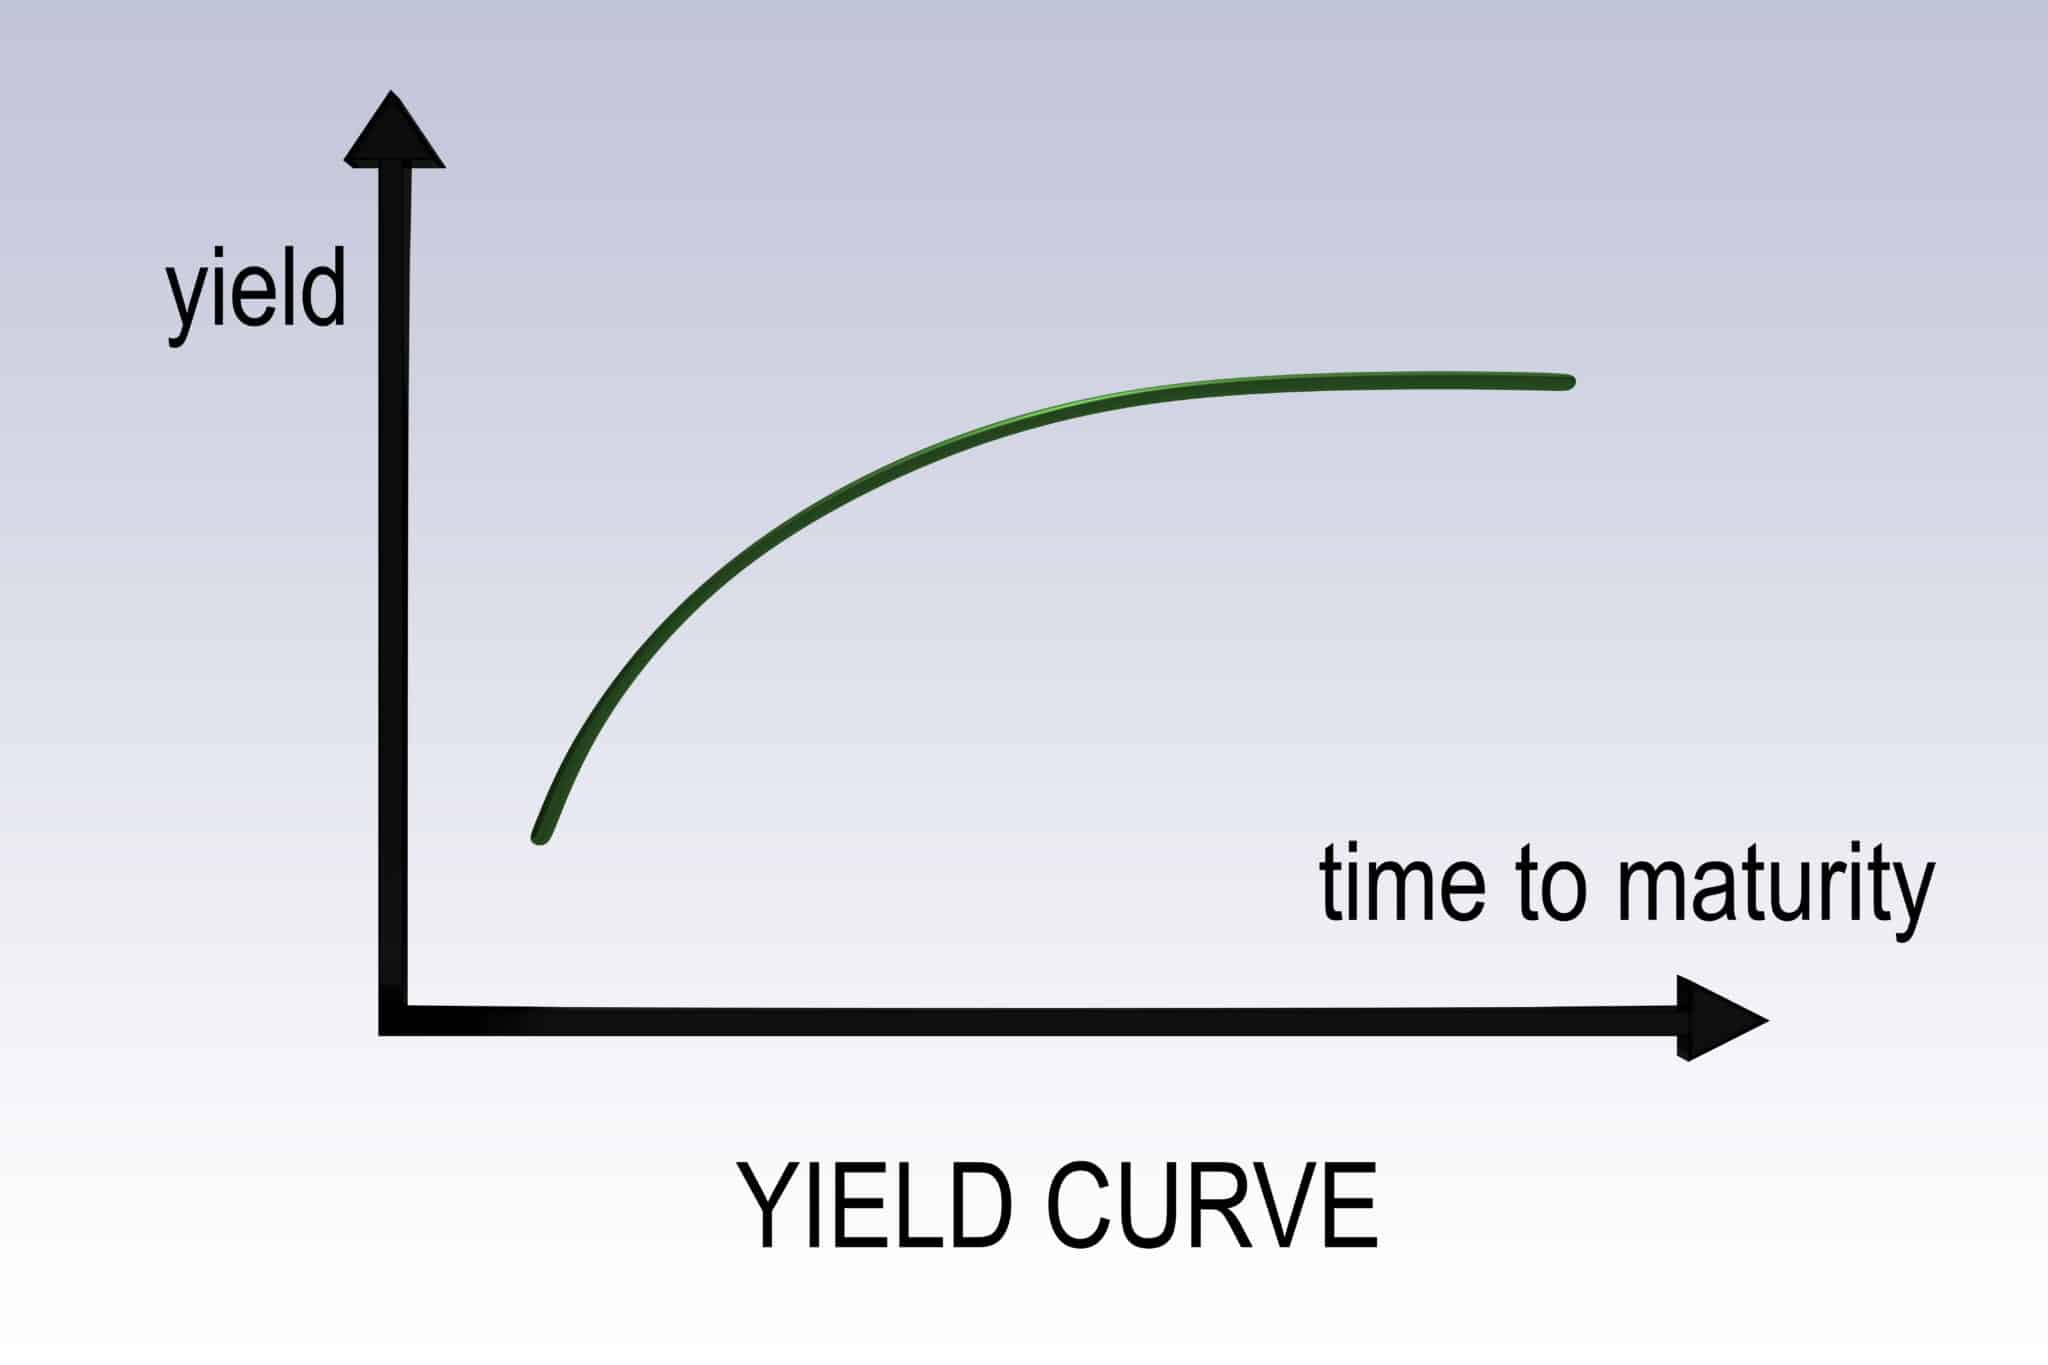
Yield Curve Definition. A Yield Curve in finance is the graphical relation between the interest rate, or cost of borrowing, and the time to maturity of the debt for a given borrower in a given currency. Typically, many traders closely follow the U.S. dollar interest rates paid on U.S. Treasury securities for various maturities. The data is commonly presented in graphical form, as in the chart below, to produce what is called “the yield curve.” Analysts focus especially on the changes in the curve shape over time and often refer to the patterns in these data as the “term structure of interest rates”. Yield curves can also be prepared for other forms of debt to observe the pricing trends in the market and to garner other indicators of the current economic condition. Yield curves are usually upward sloping such that the longer the maturity, the higher the yields with a noticeable flattening of the curve as you move toward the higher maturities. Generally, investors demand higher returns, or premium, for longer maturities due to market uncertainty, the reason for the upward slop in the curve. This pricing effect is sometimes referred to as the liquidity spread.

Forextraders' Broker of the Month
BlackBull Markets is a reliable and well-respected trading platform that provides its customers with high-quality access to a wide range of asset groups. The broker is headquartered in New Zealand which explains why it has flown under the radar for a few years but it is a great broker that is now building a global following. The BlackBull Markets site is intuitive and easy to use, making it an ideal choice for beginners.