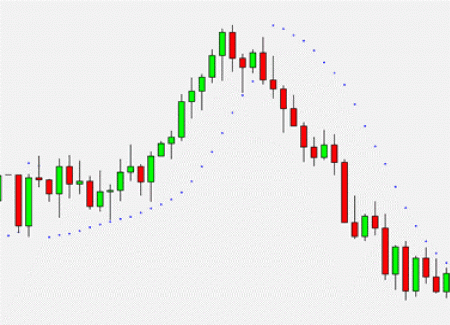
Parabolic Stop-and-Reverse Definition. What is the Parabolic Stop and Reverse? AKA the “SAR”, system is a technical analysis tool designed to find the trailing stop-loss of a currency trend based on price and time. This system was devised to supplement the inadvertent gaps that occurred with other technical indicators. The Parabolic system is not an oscillator, but it can be used in combination with them to improve results. Dots produced by the indicator suggest potential reversal points of price behavior in the trend being followed. On an uptrend, the dots chase after the rising currency prices, and conversely, the dots chase after the falling currency prices of a downtrend. If the trend fails, the SAR signal is given, signified by a new curve formation in the opposite direction. The name of the system comes from the parabolic shape of the dot curves, based on the notion that prices tend to stay within the boundaries formed by a parabolic shape during a strong trend. From the chart below, one can see the shift that happens after a trend reversal. The Parabolic SAR is one of the easier indicators to use since a buy or long position is in order when the dots are below the candlesticks, and a sell or short position is suggested when the dots are above the candlesticks. Forex traders tend to use this indicator only for “trending” markets where rallies or downturns are obvious. The tool is ineffective in “ranging” markets when sideways motion does not indicate a specific trending direction.

Forextraders' Broker of the Month
BlackBull Markets is a reliable and well-respected trading platform that provides its customers with high-quality access to a wide range of asset groups. The broker is headquartered in New Zealand which explains why it has flown under the radar for a few years but it is a great broker that is now building a global following. The BlackBull Markets site is intuitive and easy to use, making it an ideal choice for beginners.
