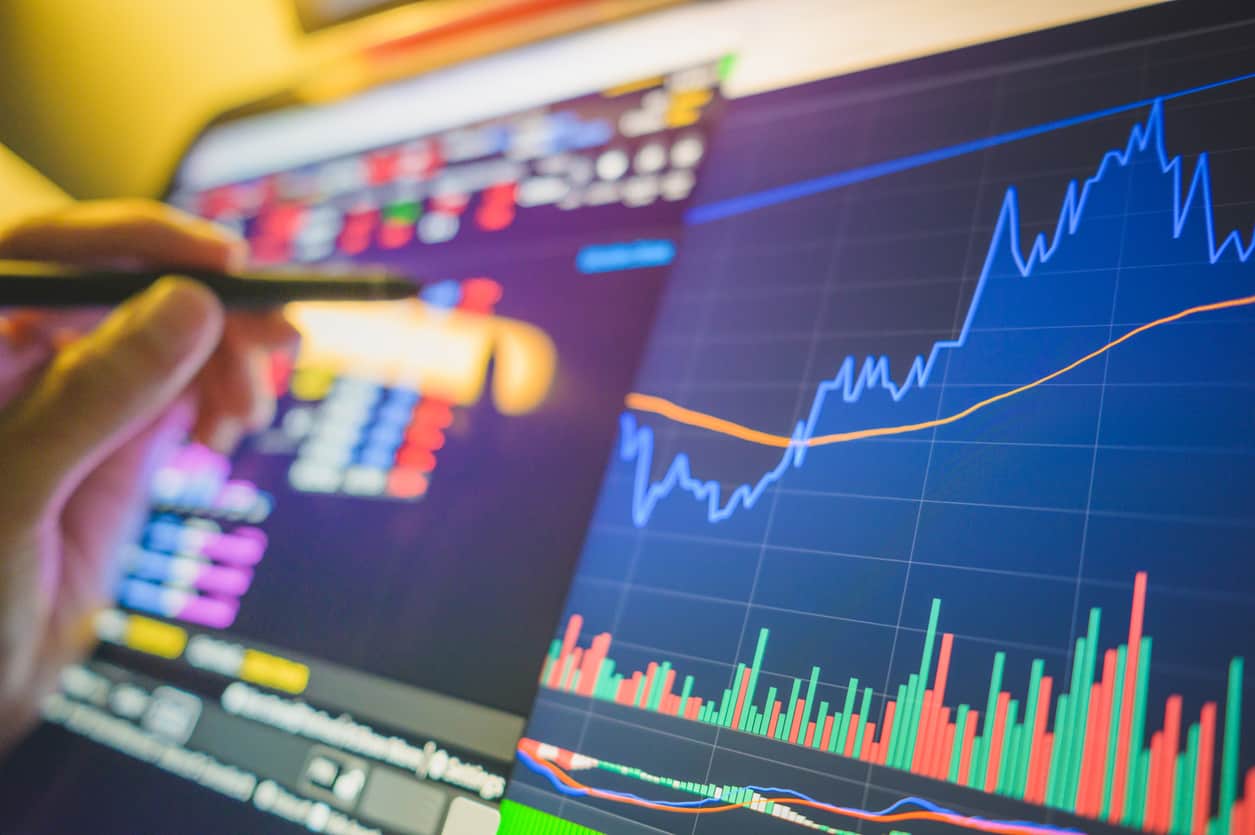

There is a general rule that traders in every genre adhere to –where there is market volatility, opportunities are plentiful. There should also be a caveat, which states that too much volatility is not a good thing. The forex market is known for whipsaw swings in pricing behaviour that can destroy even the best-laid plans of veteran traders. When the markets turn chaotic, it is best to sit back and wait, but how do you measure volatility, and are there indicators for this purpose?
In the article to follow, we will attempt to answer both of these questions. You will learn what volatility is, how to measure it, and what is a list of tried and true indicators that highlight when forex price action is about to get more turbulent. If you are to become an accomplished trader, you will want to be acquainted with this volatility indicators list and incorporate one or two of them in your daily trading regimen.
What Are Volatility Indicators?
In market terminology, volatility is a measure of the rate of change in prices for an asset over a specific time period. Forex markets are known to be highly volatile compared to stocks, for example, and some currency values can change more rapidly than others. A measure for the volatility of the EUR/USD pair versus the GBP/USD pair generally reflects that pound Sterling can change in value anywhere from 25% to 50% more than the euro in a given moment, the primary reason why trading the pound is riskier.
Volatility indicators tend to measure fear in the marketplace as uncertainty fills the minds of traders about what future prospects might be in the near term. When the level of indecision reaches a certain level, the opportunity to trade the chaotic swings in value that are surely imminent is an alert for traders to man the stations and prepare for action. Too much chaos, however, can cause wide erratic swings in both directions, slashing through stop-loss orders and causing immeasurable harm, especially if leverage levels are high.

The best measures of volatility tend to rely upon statistical concepts, whereby the changes in prices begin with an average and then add standard deviations derived from this mean value. If you cringe when you hear statistical terms, do not fear. Trading platforms do the calculation work in the background, providing, as a result, a visual representation that can be easily interpreted. If you would rather avoid statistics, basic volatility measures can also rely upon simple moving averages, as well. Testing these on a demo system is one way to determine your favourite.
One key takeaway is that when volatility increases abruptly, it is a sign that a directional change in pricing behaviour is imminent. It may not give you an insight as to which direction may win out, but observing the path as it plays out and using another indicator can help ascertain whether the trend will be up or down. The longer that volatility remains low is also an alert that a major shift is on the way. Markets tend to level out before major economic announcements, but then chaos breaks forth eventually.
What causes market volatility? The same factors that weigh heavily on the valuation of a given forex pair also can have a heavy impact on volatility. Economic announcements are just one factor. Geopolitical issues can provoke major swings in the mindset of investors, as can any mention of a trade war or supply chain interruption. Lastly, central banks can change monetary policy in an instant, wreaking havoc on interest rate comparisons around the world.
Observing the volatility rollercoaster, both up and down, can lead to profitable trades on a consistent basis by giving you the edge necessary to win when trading foreign exchange pairs. Veteran traders understand this simple principle, and you will, too, after you become familiar with how to see the onset of forex volatility.
Let’s now review a few of the best volatility indicators used by veteran forex traders:
Moving Averages
The most basic barometer for price volatility is a Simple Moving Average (SMA). Prices are added for a chosen time period, then divided by the number of periods. If prices are flat or range bound, then the SMA will be like a flat line on an EKG. When prices start to fluctuate, the SMA will move in the direction of the price movements.
The problem with an SMA is that it is viewed as a lagging indicator. With equal weighting of all prices over a period, new changes in price will not be reflected as quickly as you might like. A partial solution to this lagging effect is to give the more recent price points more weight in the calculation. The best example of this approach to this re-weighting concept is an Exponential Moving Average (EMA). An EMA is more reactive to current market conditions and, therefore, more effective.

Bollinger Bands
Bollinger Bands (BBs) are very popular when it comes to measuring volatility from a statistical perspective. The three lines or ‘bands’ are actually an overlay on the pricing chart, giving the trader an instant visual read on price behaviour changes. The central line is a 20-period SMA, while the other two lines reflect two standard deviations, both positive and negative, about the centreline.
The highest volatility occurs when the bands are farthest apart, but the BBs are very effective at providing alerts for when price changes are imminent. It is sometimes called an ‘accordion effect’. When volatility is low, the bands constrict like an accordion. Markets range most of the time, but not forever. A wise trader understands that tight bands connote a major change in price behaviour is on the near-term horizon.
Average True Range (ATR)
An ATR is a great tool for beginners because it is easy to understand. The indicator appears in a separate box on the bottom of the chart and indicates the likelihood of a near-term change in price directions. The calculations are simple, taking the differences between the current day’s high and low, along with similar differences from the previous day’s close. The highest of the three values becomes the data point. It, too, is a lagging indicator.
Keltner Channel
This indicator is similar to BBs, but twice the size of the ATR is used about a 20-period EMA, instead of using two standard deviations. These bands are tighter. The trader looks for prices to penetrate the bands on either side as a signal to trade. The Keltner Channel, however, does not react as quickly as Bollinger Bands.
Donchian Channel
This indicator is another three-banded overlay system. The highest band is the highest price over the previous ‘N’ periods, while the lowest band is just the opposite. The midline is the average of these two values. The Donchian Channel is helpful in denoting extreme bullish and bearish data points while also highlighting trends and signalling imminent reversals.
Concluding Remarks
Veteran forex traders understand that following volatility measures is a necessary step before capitalizing on movements in the forex marketplace. When volatility picks up or remains low for a period of time, the wise trader prepares to take action. Become acquainted with these volatility indicators and pick one for further study and use on a demo system. When your daily strategy includes a volatility measure, you may see your success rates improve over time.
Forextraders' Broker of the Month
BlackBull Markets is a reliable and well-respected trading platform that provides its customers with high-quality access to a wide range of asset groups. The broker is headquartered in New Zealand which explains why it has flown under the radar for a few years but it is a great broker that is now building a global following. The BlackBull Markets site is intuitive and easy to use, making it an ideal choice for beginners.
