Fibonacci levels are used extensively by technical traders to either identify levels of support or to predict the possible direction of future price movement. With so many traders using Fibonacci levels, it is important that a novice trader understands how these levels are commonly used and why using Fibonacci levels to scalp forex is something traders may wish to consider.
In this article, we will explain what Fibonacci levels are, their useful trading applications, and how they can be used as part of a Fibonacci scalping strategy.
What Are Fibonacci Levels?
Leonardo of Pisa (also known as Fibonacci) was a famous Italian mathematician who lived during the Middle Ages. He was the first person to introduce a special sequence of numbers to the Western world and Europe.
When these numbers are combined in a certain way, a special sequence of ratios appear that are today widely used by mathematicians, scientists and even traders.
Fibonacci ratios or levels, as they relate to trading, form an important part of a trader’s technical analysis skills. The most commonly used ratios in trading are the 23.6%, 38.2%, 50.0%, 61.8%, 78.6% and 100% levels.
Next, we will discuss the two main Fibonacci drawing tools included in most trading platforms, and how they are used in technical analysis.
Trend Following Using Fibonacci Levels
Fibonacci extension levels are typically used by traders to follow a trend. These levels tend to act as magnets during a strong trend as they attract price towards them. Knowing this allows traders to determine where they should position their targets or at which levels support/resistance might occur during a trend.
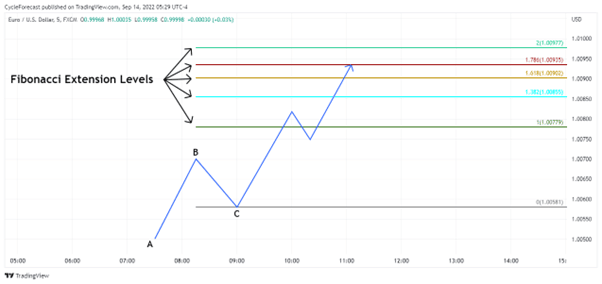
Image for illustration purposes only
The illustration above shows how the Fibonacci extension levels tool can be used to determine where a trend might move towards. Using an uptrend as an example, a trader will need to select three points on a chart to draw Fibonacci extension levels – the first point being the starting point of a trend (labelled A), the second point being a swing high prior to a correction (labelled B), and the final point being a higher low (labelled C).
Once all three of these points have been selected in order, Fibonacci extension levels are automatically calculated using the distance from point A to B and projected upward from point C.
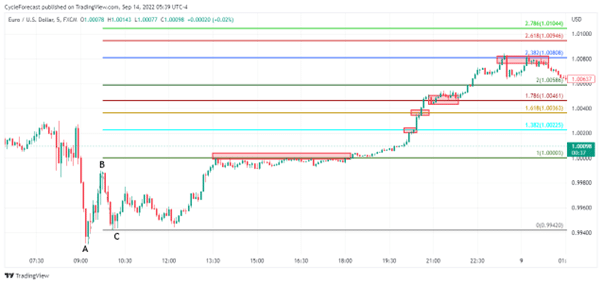
Image for illustration purposes only
Our next image shows a chart of the EUR/USD on a five-minute timeframe with the Fibonacci extension levels applied following the same procedure as discussed before. Note how price moved to the first 100% extension level, found resistance for a period of time, but then broke above it and moved toward the 138.2%, 161.8%, 178.6%, 200% and 238.2% extension ratios.
Some of these extension ratios acted as initial resistance as price moved upwards, while some acted as support after price broke above them and pulled back towards them.
This price behaviour can offer fantastic trading opportunities for trend followers by entering positions as price breaks above an extension level and taking profit at the next extension level higher up.
Scalpers who were already long at point C, for example, may have placed a target at the 100% extension level or multiple targets at the next levels higher up.
Counter-Trend Trading Using Fibonacci Levels
The next most commonly used Fibonacci drawing tool is the retracement tool. Traders use this tool to determine levels of support or resistance during a corrective phase within a trend.
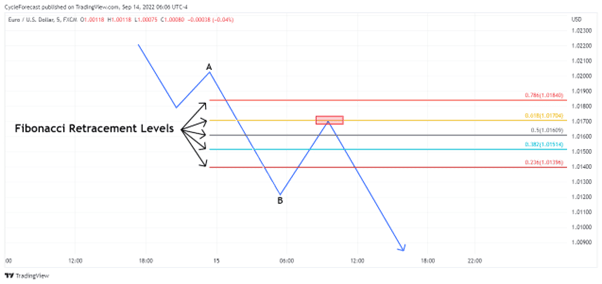
Image for illustration purposes only
The illustration above shows how the Fibonacci retracement levels can be used during a downtrend to determine where a counter-trend correction might find resistance and end.
This time, however, only two points need to be selected on a price chart for the Fibonacci retracement tool to automatically calculate the retracement ratios. Point A was selected because it was an area where a previous correction ended, and point B was selected as soon as a new counter-trend move started.
Traders will often pay close attention to the 61.8% Fibonacci retracement level, which is also known as the golden ratio. Counter-trend reversals typically end at this ratio and can offer a good trading opportunity to trade with the main direction of a trend.
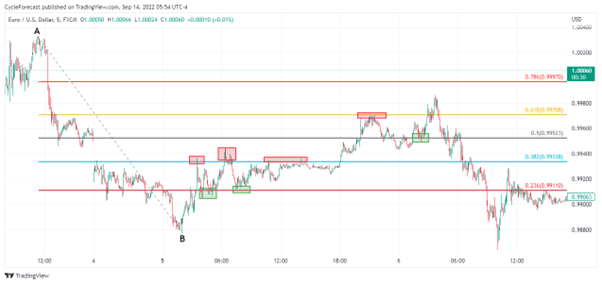
Image for illustration purposes only
Our final chart image shows a counter-trend reversal that appeared during a downtrend on a five-minute timeframe of the EUR/USD.
Note what happened when price hit the 61.8% Fibonacci level (yellow line) on two separate occasions. On the first visit to the 61.8% Fibonacci level, price found resistance and briefly moved lower, but eventually the correction ended the second time price tested the same level.
Although trend-following traders might have decided to join the downward trend again at the 61.8% Fibonacci level, it is also interesting to note that many Fibonacci scalping opportunities presented themselves while price was bouncing between the lower Fibonacci levels on the way up.
Trading against the trend might be risky for some, but because scalpers seek to trade small price movements in any direction, these Fibonacci retracement levels can make for an interesting Fibonacci scalping strategy.
Assuming that a trader expected an upward move from point B, and knowing that the 61.8% Fibonacci retracement level might be the area where a counter-trend move was likely to end, long positions could have been taken each time price pulled back and found support at the lower Fibonacci levels (indicated by the green boxes).
More experienced scalpers might even have taken short positions at the areas indicated by the red boxes because they don’t necessarily aim for targets located at the lower Fibonacci levels but aim for a few pips instead.
Conclusion
Traders who operate on smaller timeframes might find that Fibonacci scalping can offer many trading opportunities. As so many traders use Fibonacci levels as part of their strategies, a lot of price activity happens at these levels, which can create the ideal conditions for scalping Fibonacci levels.
In this article, we discussed what Fibonacci levels are, how traders typically use the different Fibonacci tools, and why. Hopefully, you will now have a better understanding of Fibonacci levels and how they can be used for scalping the forex markets.

Forextraders' Broker of the Month
BlackBull Markets is a reliable and well-respected trading platform that provides its customers with high-quality access to a wide range of asset groups. The broker is headquartered in New Zealand which explains why it has flown under the radar for a few years but it is a great broker that is now building a global following. The BlackBull Markets site is intuitive and easy to use, making it an ideal choice for beginners.