The world’s top cryptocurrency just cannot wade out of the woes caused by the bear market of the last 9 months. As soon as it mounts anything resembling a rally, the bears step in and punish the bulls instantly and severely. On Monday, following yet another timid rally attempt, the price of BTC dropped past a critical support level, thus opening up the path for further potential losses.
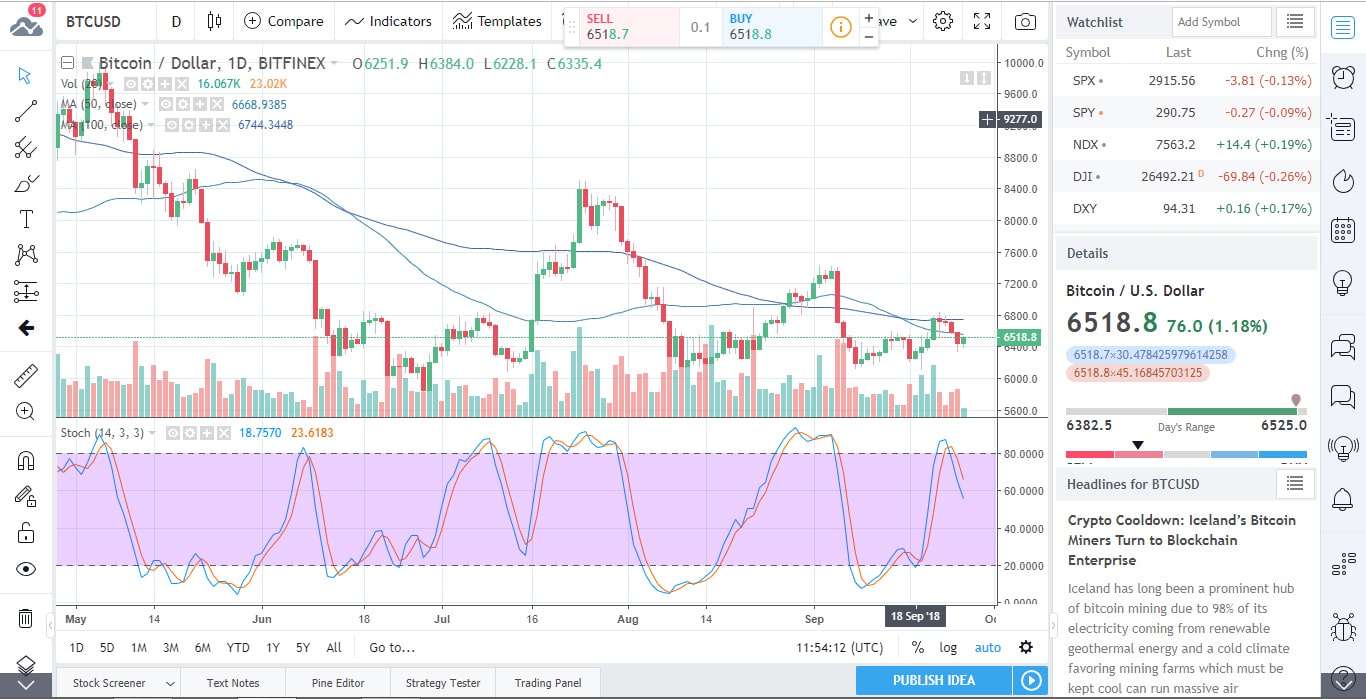
Why has the outlook turned so bearish again? After all, the price has weathered several deeper losses over the last few weeks than the current one. This time around, the bears have been ushered in by a crossover of two MAs: the 5-month MA crossed the 10-month one from above, in a definite bearish move, opening the road to sub-6k prices – at least in theory.
In practice, BTC’s price has thus far held up decently. It is currently trading at $6,434, and it is actually ticking upward little by little, after it probed depths in the neighborhood of $6.2k.
To place this whole situation into context, we need to bear in mind that the bearish resurgence came about after a bullish move past the $6.6k resistance level on Friday. This move opened the path to $7.1k – in theory at least. Instead of heading that way though, the price fell back to below $6.6k by Saturday.
What’s next according to technical analysis then?
According to the monthly chart, the probability of a downside break has increased. The short-term bullish outlook has been neutralized and a decisive move below the $6,350 support level – established yesterday by the price-bounce – would open the way to $5,755, near the 2018 low.
On the upside, the medium-term resistance is at the $6.5k mark. Why would the price mount an attempt on that level though? It has already climbed above the short-term trend line resistance on the hourly chart, so there may indeed be some timid bullish momentum in it. The question is obviously: will it clear the $6.5k hurdle?
What do the technical indicators say though? Lately, most of them have been stuck in Sell territory, for what seems like forever.
Indeed, the moving averages continue to advertise that sentiment: some 14 of them that is, with only one – the Ichimoku Cloud Baseline -stuck in neutral territory. None point to Buy.
On the other hand, the oscillators are far less decided in the matter. 8 of them are neutral, while the Awesome Oscillator and the Momentum point to Sell. The MACD Level on the other hand, points to Buy.
What about the fundamentals? Though news have been relatively lazy these days and good news few and far between, some significant bits of new information have surfaced recently.
Following in the footsteps of Facebook, Google have recently announced that they would relax their rules (which currently amount to an outright ban) concerning cyptocurrency advertising.
In the wake of the flurry of scams and fake ICO’s stirred up by the latest crypto bull run, social media and search giants have decided to banish all traces of cryptos from their advertising networks. Since then though, Facebook have made an about-face on the issue, allowing all crypto advertising, with the exception of ICOs. Those wishing to advertise in this vertical though need to acquire a special permit from the platform owner.
Google are now apparently set to follow suit.
In other news: Bakkt have recently made an announcement regarding the avenue they’re likely to take in regards to Bitcoin futures contracts. According to this announcement, the platform will deliver physical BTC into the accounts of those who purchase such futures contracts, on a daily basis.
In the meantime, BTC’s volatility has reached the lowest level in the last two years.

Forextraders' Broker of the Month
BlackBull Markets is a reliable and well-respected trading platform that provides its customers with high-quality access to a wide range of asset groups. The broker is headquartered in New Zealand which explains why it has flown under the radar for a few years but it is a great broker that is now building a global following. The BlackBull Markets site is intuitive and easy to use, making it an ideal choice for beginners.