Who are “They”? – you might ask…Why, Bitcoin technical analysts, of course…The same people who always seem to throw around weirdly named chart- and candlestick patterns? The very ones. This time around though, their doom-heralding is backed by the fundamentals too, and that is never good news. What exactly are we talking about?
A short couple of days ago, Bitcoin was in the middle of mounting what looked like a promising rebound effort. Having had its price knocked down to sub-10k levels, the world’s best known cryptocurrency was spiking back above the 9k mark, with Eliott Waves taking shape and the works. Then, suddenly, everything went downhill again, and a boatload of bearish technical factors popped up, which now may point to a downward slide unlikely to find proper footings above the $5,500 mark.
The last such floor that BTC’s sliding price found was at $8,371 on March 9. Since then, trading volumes dropped by a massive 50%, and indeed, the price itself dropped past that mark, currently treading water just above $8k. With the bearish tendency evident, the inverted bear flag pattern was long broken out of, downwards, so what some analysts feared just a handful of hours ago, has come to fruition. According to some, this break means nothing less than the likely revisiting of the $5.5k mark, setting a new low for the currency in 2018.
The only move that would invalidate the above detailed signals would be one pushing BTC above $9,612, but let’s face it: that is indeed highly unlikely.
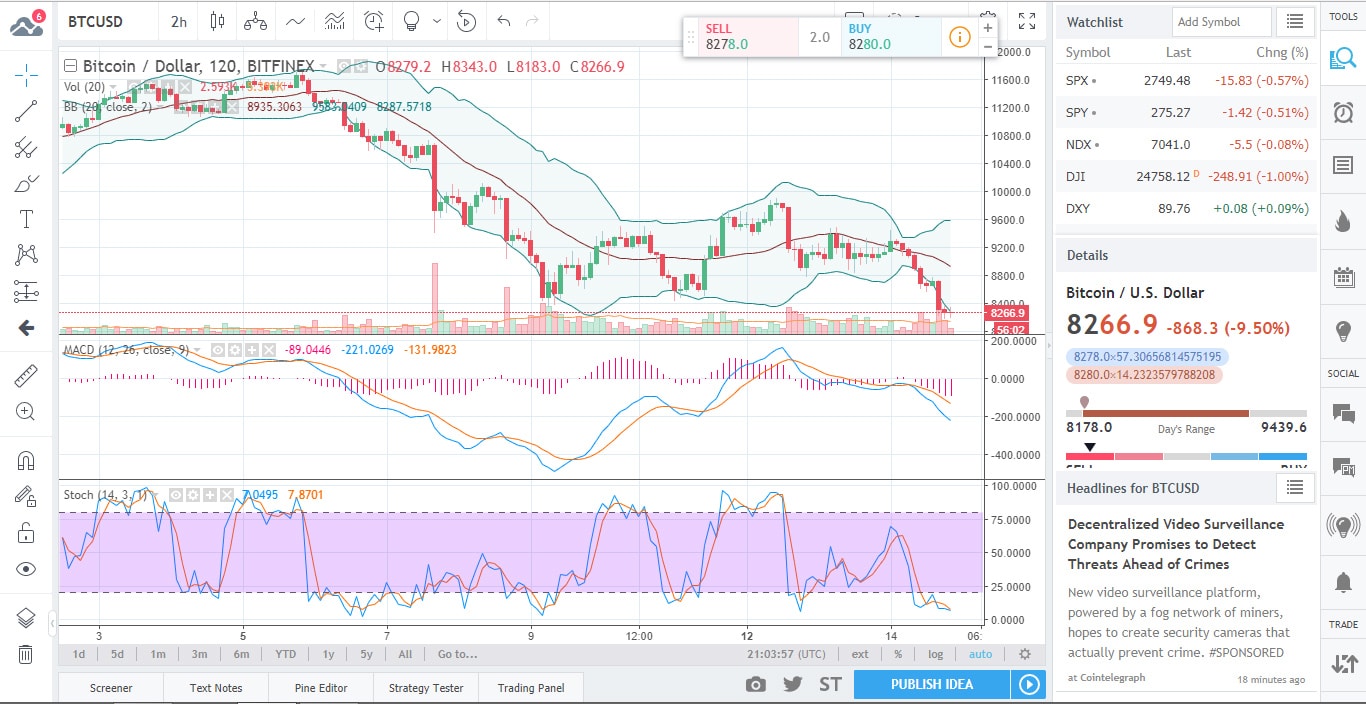
As visible on the chart above, the downward break of the price looks very determined, even as the stochastic oscillator is screaming its head off in its oversold zone.
What exactly are the fundamentals we briefly mentioned in the article intro though?
Well, things aren’t really looking good for BTC on the fundamentals front either. First off, we have Goldman Sachs doing what they do best in regards to cryptos: sowing FUD. According to their latest statements, they expect BTC to drop to below-$6,000 levels. Normally, this wouldn’t mean a whole lot, considering the source, but this time around, as showcased above, the technical signals have lined up behind this prediction too.
The other – much more worrying – piece of news concerns Mt. Gox’s liquidators, who have already dealt BTC a blow earlier this year, by flooding the market with tens of thousands of coins recovered from the ruins of the new defunct exchange.
Apparently, these people may decide at any time to make yet another move in the vein of the above said one and they do indeed have plenty of ammo left for it: they still have more than 166k BTC in their possession.
The real problem with this hoard is that its potential sale may not even be governed by the market and good old-fashioned greed. If the liquidator is given the green light by the Japanese authorities, it may flood the market, regardless of the current price of the digital asset. Whatever happens, the specter of Mt Gox’s hundreds of thousands of BTCs will continue to haunt the market for as long as they aren’t properly re-absorbed into the ecosystem.
What about the other cryptos?
Feeling the pull of the bears currently shredding its bigger sister, Bitcoin Cash has been having a rough time lately too. It has dipped below the $1k mark, and there is no reasonable floor on the horizon for it.
ETH is flirting with the sub-$600 zone itself, but its downward spiral has been somewhat more tempered than that of BCH.

Forextraders' Broker of the Month
BlackBull Markets is a reliable and well-respected trading platform that provides its customers with high-quality access to a wide range of asset groups. The broker is headquartered in New Zealand which explains why it has flown under the radar for a few years but it is a great broker that is now building a global following. The BlackBull Markets site is intuitive and easy to use, making it an ideal choice for beginners.