The last couple of days saw the price of the top cryptocurrency break free of the grip of the bears – perhaps for good. Moving from around $4.1k all the way to $5.3k at one point, the price broke one resistance after the other. Possibly triggered by a massive 20,000 BTC purchase, completed through the top exchanges, the breakout may have been the early herald of the upcoming bull market.
Since its heroic dash to a little above $5.3k, Bitcoin has gone through a bit of an expected correction. It is currently trading at $5,018, having found support at $5k.
The significance of the upward move was not lost on anyone however. From a technical perspective, it does indeed look much more impressive than based solely on its gains.
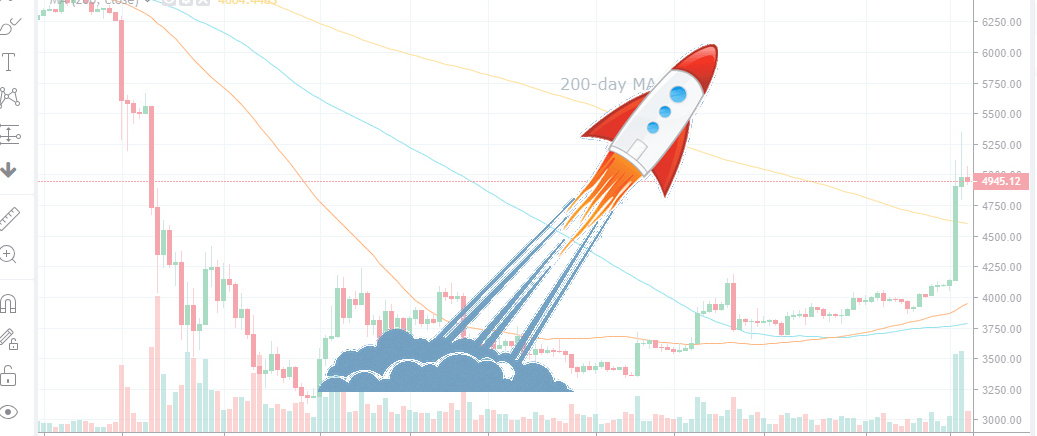
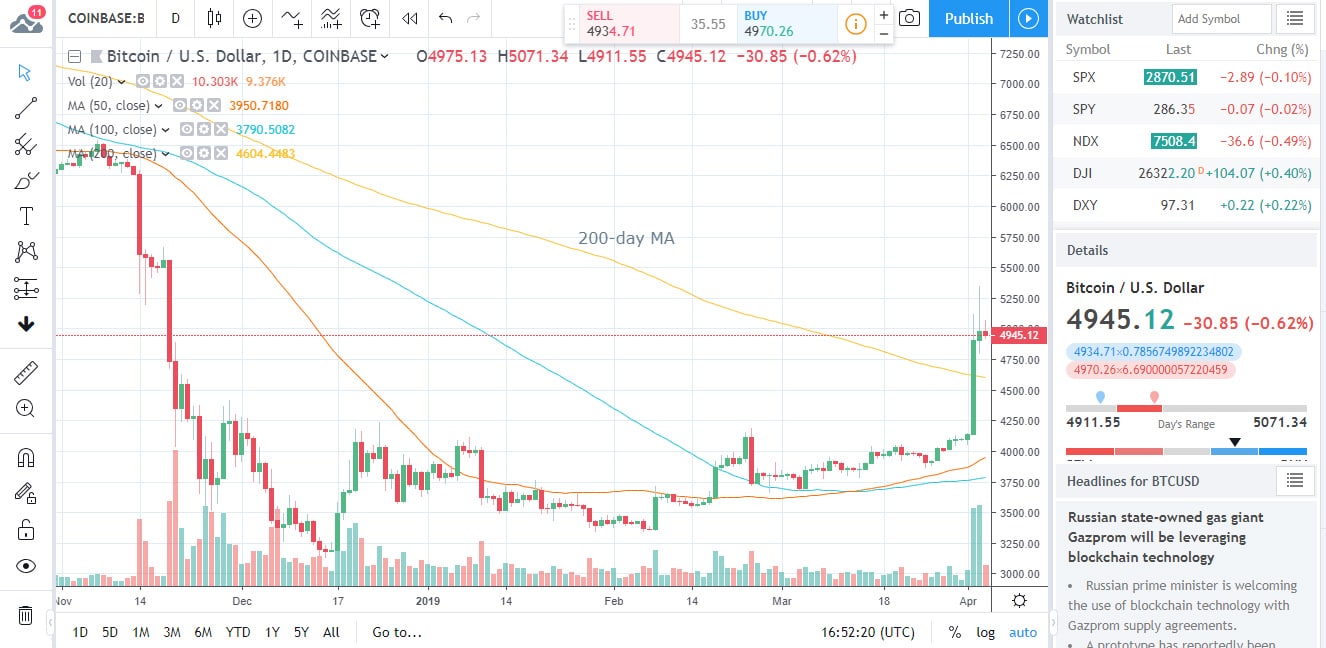
The move shattered no fewer than 3 Moving Averages: the 50-day, the 100-day and the 200-day ones. Such an audacious feat has not been accomplished in the last 15 months – essentially since the beginning of the bear market.
Of these three technical levels, the 200-day MA carries special significance. It is often considered the dividing line between strong and weak markets.
Interestingly, the last time the price was above all three moving averages was back in early 2018, around the $15,000 mark.
Historically, the breaking of all MAs coincided with the beginnings of past bull markets. In October 2015, a similar move marked the beginning of the bull market that would result in the parabolic FOMO-fuelled rise of 2017.
Furthermore, the price never dropped below the 200-day MA throughout the entire 2017 uptrend.
Mathematically speaking, during the time it spent above the 200-day MA in 2017, BTC registered gains of about 2,700%.
With the above in mind, it is clear that the 200-day MA is the indicator to watch. When the price can close above it consistently, that’s probably when we can call the beginning of the bull market.
As far as price prediction is concerned, $4,236 is level to watch. As long as BTC stays above it, its overall outlook will remain bullish. Some corrections – and a possible pullback all the way to $4,700 – are most definitely also in the books. The 14-day RSI is already pointing to overbought conditions.
What about the fundamentals? The recent upward jerk was most definitely a fundamentals-induced one.
That said, there has been a lot of speculation concerning the causes of the breakout. Obviously, no one knows anything certain. Market activity has most definitely been the main “culprit” though.
It looks like a single, algorithmically managed order injected some $100 million into BTC, through several exchanges, such as Kraken, Bitstamp and Coinbase.
According to Bitfinex, the said BTC shopping spree came coupled with a sudden drop in BTC/USD short positions. Since then, this metric has recovered to a certain degree.
Other factors which could have had an effect on the breakout are the expected halving of BTC mining rewards and the general TA setup.
While the halving is expected to come about in May, 2020, the market has traditionally factored it into the price a year ahead.
The technical analysis picture has turned into an increasingly bullish one over the last few weeks. Upward pressure has been mounting, and that was definitely a contributing factor to Tuesday’s upward rush.
News-wise, the vibe has also been suspiciously positive lately. DLT is gaining more and more recognition and traction apparently. Scores of central banks are considering blockchain-based currencies – according to a World Economic Forum report.
Whether this is indeed good news for the current crypto ecosystem is highly debatable. It looks more like a last-ditch effort to jump aboard the coming crypto train, on these banks’ own terms.

Forextraders' Broker of the Month
BlackBull Markets is a reliable and well-respected trading platform that provides its customers with high-quality access to a wide range of asset groups. The broker is headquartered in New Zealand which explains why it has flown under the radar for a few years but it is a great broker that is now building a global following. The BlackBull Markets site is intuitive and easy to use, making it an ideal choice for beginners.