The price of the top cryptocurrency has been struggling sideways around the $4,000 mark for a few days now. To raise the possibility of a bullish reversal next month, the price needs to hit the $4,190 level. Is that a real possibility? A recent spike to over $4.1k says it is indeed. Does this mean we’re not going to see a $3k Bitcoin ever again?
The question on everyone’s mind is: has the crypto market and Bitcoin in particular really bottomed? Are we about to see the early pangs of the next bull run?
The way the technical factors are currently lined up, that is indeed a real possibility. Although it failed a few times to convincingly leave behind the psychological resistance of $4k, the price of Bitcoin shot up massively earlier today, hitting a 5-week high. It also drew a pattern that is reminiscent of the 2015 recovery, which eventually led up to the 2017 bull market explosion.
The monthly chart makes it clear that this recovery – if it indeed turns into that – started way back in February. The February candlestick was not just the first green one in 7 months, it completely engulfed the January one.
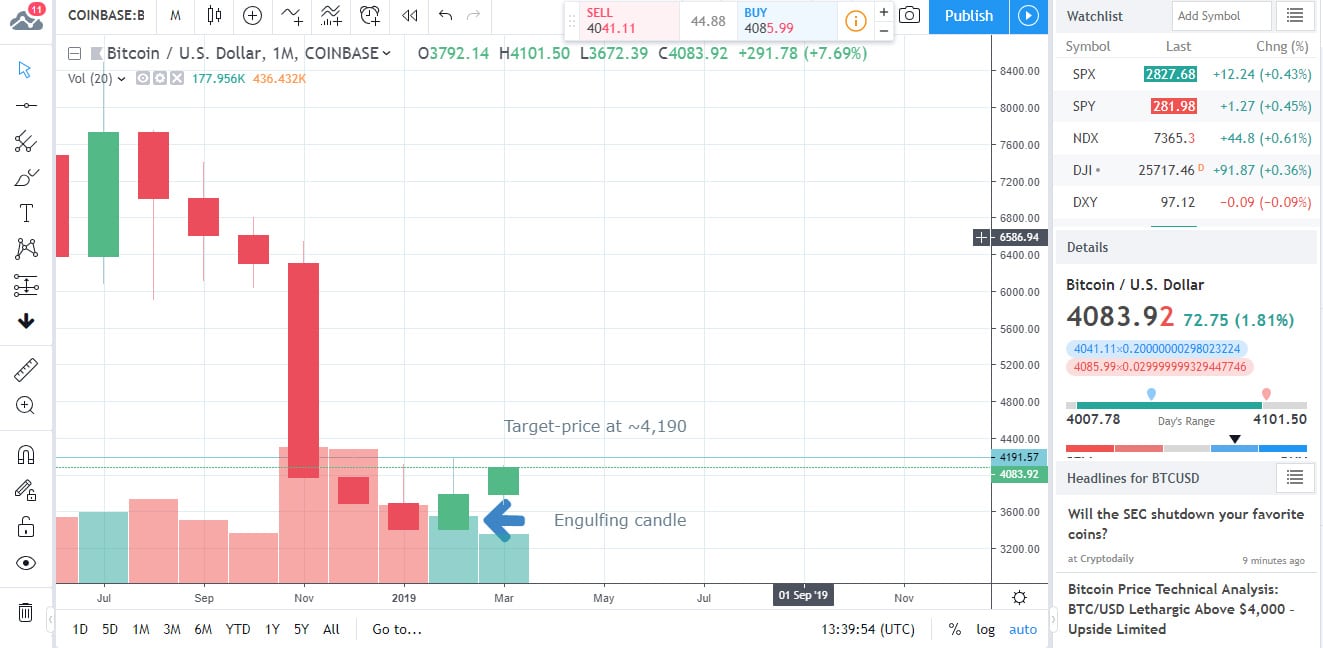
The keep the bullish case alive, the March candlestick needs to end up above the wick of the February one. What this means is that the price needs to end up above $4,190 on March 31.
If it does hit that mark, then the doors will be open all the way to $5,000 in April. To kill the short-term bullish momentum, prices need to find acceptance below $4,055 – which is well within the realm of possibility too. This is where the March high currently sits.
The 30-day MA represents the target for the bears. If they manage to drag the price below $3,900, they will have effectively defused the current bullish setup.
Despite the bullish scent in the air, BTC price may end up treading water within its current trading range for a few more months, before a proper breakout happens.
The 200-cycle MA on the 3-day chart has leveled out. This indicator has not accomplished such a feat since 2015.
In a somewhat contrarian manner, this MA has just lost its bullish bias now. It needs to be pointed out that it is a lagging indicator though. Back in 2015, it exhibited similar behavior before the beginning of the bull market.
It turned bearish just as the price was beginning to shoot upward.
What do the fundamentals say?
There has been a lot of fuss raised lately about the fake crypto trading volumes generated by various exchanges through wash trading.
A report produced by Bitwise Asset Management for the SEC, alleges that some 95% of the total crypto trading volume is faked. While that number is quite stunning, it is difficult to contradict many of the findings of the said report.
According to the report, there are only 10 exchanges out there, with significant real trading volumes. Two of these exchanges are Binance and Bitfinex.
Apparently, these two account for some 50% of the total BTC spot trading volume. They both use tether however and none of them are properly banked. Furthermore, Binance was funded through and ICO and it maintains a token that is certainly dubious from a regulatory perspective.
The conclusion of the report can only be one. The BTC market is far from a mature one, with two unbanked exchanges making up the bulk of its real trading volumes, exchanges which use an unaudited and unregulated stablecoin.
In other news: Facebook has continued its blockchain-linked hiring spree, announcing 5 more jobs in the vertical.

Forextraders' Broker of the Month
BlackBull Markets is a reliable and well-respected trading platform that provides its customers with high-quality access to a wide range of asset groups. The broker is headquartered in New Zealand which explains why it has flown under the radar for a few years but it is a great broker that is now building a global following. The BlackBull Markets site is intuitive and easy to use, making it an ideal choice for beginners.