Over the last few days, the price of bitcoin tentatively approached the $20,000 psychological level, looking to perhaps fire a few exploratory shots into the unknown beyond. Those looking to celebrate the reaching of yet another milestone before the end of 2017, will have to table their expectations, though they may get the fireworks they’re expecting yet.
What does technical analysis say?
While many of the technical factors seem to point to a prolonged upcoming correction mode for the BTC/USD pair, we all know that technical analysis has not exactly been proven reliable or even mildly relevant in regards to this asset class. We’ll take a closer look at it regardless though, just to consider “the other” side of the coin, too.
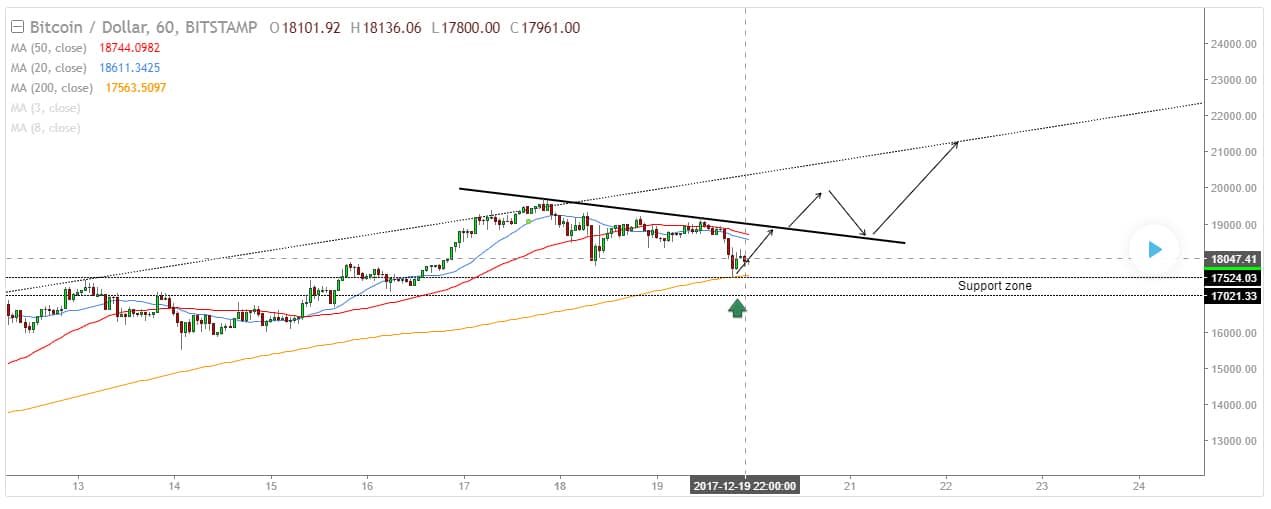
– The first sign of an impending trend reversal came in the shape of a hanging man candle-pattern, which popped up shortly after the bounce-back from the freshest historical high.
– The RSI is signaling a bearish divergence as well, with a trendline support materializing at the $17,500 price-level.
– The 5-day and 10-day MAs though put a major hole into the above, remaining curled upward, indicating continued bullish tendencies. These contradictory signals provide a perfect picture of the futility of technical analysis regarding BTC/USD.
The Fundamentals
Unlike technical analysis, the fundamentals have time and again turned out to be relevant heralds of upcoming BTC price-swings, and we have no reasons to view them otherwise this time around either. Against the backdrop of the recent launch of CME’s bitcoin-based futures, and re-emerging talk concerning the SegWit2x hard fork, the price of the digital currency has once again started inching upwards. At the time of writing, it has again climbed past the $18k mark, according to CoinDesk’s BPI.
When looking at the fundamentals, one should not ignore the potentially self-fulfilling nature of the fact that many people would simply love to see BTC hit the $20k milestone before 2018 is officially ushered in.
Stirring up the fundamental waters is the recent announcement concerning the bankruptcy declared by South Korean Bitcoin exchange Youbit, which got stripped of some 17% of its total assets by a hack that occurred earlier today. The attack was the second one targeting the exchange this year, and it apparently managed to put the final nail in its coffin. Unfortunately, it appears that users may not get all their funds returned, and that – as Seinfeld would postulate – “is not going to be good for anybody…”
BCH, ETH Pick Up the Slack
While Bitcoin has been struggling with headwinds over the last couple of days, Ethereum and Bitcoin Cash have been chasing fresh historic highs of their own.
BCH’s previous record high of $2,477.65, registered on November 12, has been shattered earlier today. Even though the BTC/USD has staged a pullback of its own since, it is once again heading upward, looking to re-test the $2.5k level. What’s truly significant about this “minor league” rally is the fact though that through it, above and beyond the fiat aspect, BCH has registered gains against BTC. Furthermore, BCH technical analysis points to further potential upside. The upward-curling 5-day and 10-day MAs, as well as the RSI are all bullish.
Some analysts feel however that if a major setback were to befall BTC, BCH’s currently unfolding rally could fall apart in a hurry.
ETH has been riding its own bulls, to highs around the $850 mark.
The Bottom Line
Despite several authorities coming out swinging against bitcoin (and cryptocurrencies in general) in recent days, a rally past the $20k mark is still in the books for 2017 for BTC.

Forextraders' Broker of the Month
BlackBull Markets is a reliable and well-respected trading platform that provides its customers with high-quality access to a wide range of asset groups. The broker is headquartered in New Zealand which explains why it has flown under the radar for a few years but it is a great broker that is now building a global following. The BlackBull Markets site is intuitive and easy to use, making it an ideal choice for beginners.