For more than a week now, we’ve been hearing about the price of Bitcoin nearing a “Death Cross” chart feature, a sort of milestone dangled as some kind of ominous herald of yet more gloom and doom. The ominous nature of its name cast aside, the Death Cross is indeed real, and while it is the hallmark of long-term bear markets, in this instance it may end up foretelling something entirely different.
Before we take a closer look at the implications that Bitcoin’s “Death Cross” bogeyman carries, let us once again clarify what it really is: in this instance, the Death Cross occurs when the 50-day MA cuts the 200-day MA from above. From this alone, it is clear that such a pattern may indeed herald the onset of a long-term bear market. Since – according to common logic – most people have invested in BTC as a store of value, such a turn of events may indeed trigger yet another massive sell-off. Some of the more pessimist analysts see the price of the most popular cryptocurrency hitting lows around the $2,800 mark, as a result of this selloff, but the big question here is: is such a selloff indeed in the books at this point.
Bitcoin bears have been shredding and ripping the digital asset for quite a while now and -barring some kind of an unexpected boost (like Mt Gox’s liquidators tossing a few tens of thousands of BTCs onto the market again) it is safe to assume that by now, they have mostly run out of steam. To this, we need to add the fact that the Death Cross is a pattern that mostly pops up at the end of long bear-runs, indicating the impending reversal of the dominant trend. Just remember that BTC has shed some $14,000 in value over this bear run, and that’s mostly fed the hungry beasts.
Historical data seems to back this theory as well. Back in 2014, BTC hit rock-bottom shortly after a similar Death Cross, at the $360 mark. A couple of other Death Crosses, seen in early September 2014 and mid September 2015 failed to yield further price-drops too.
Of course the variables involved in the equation are different this time around. The added steam that futures trading alone may lend the bears cannot be overlooked, and it is indeed just one of these newly minted variables.
Currently trading at around the $7,500 mark, BTC has put the Death Cross in the rearview mirror. What comes now will set the record clear about the bulls and the bears for at least a handful of weeks.
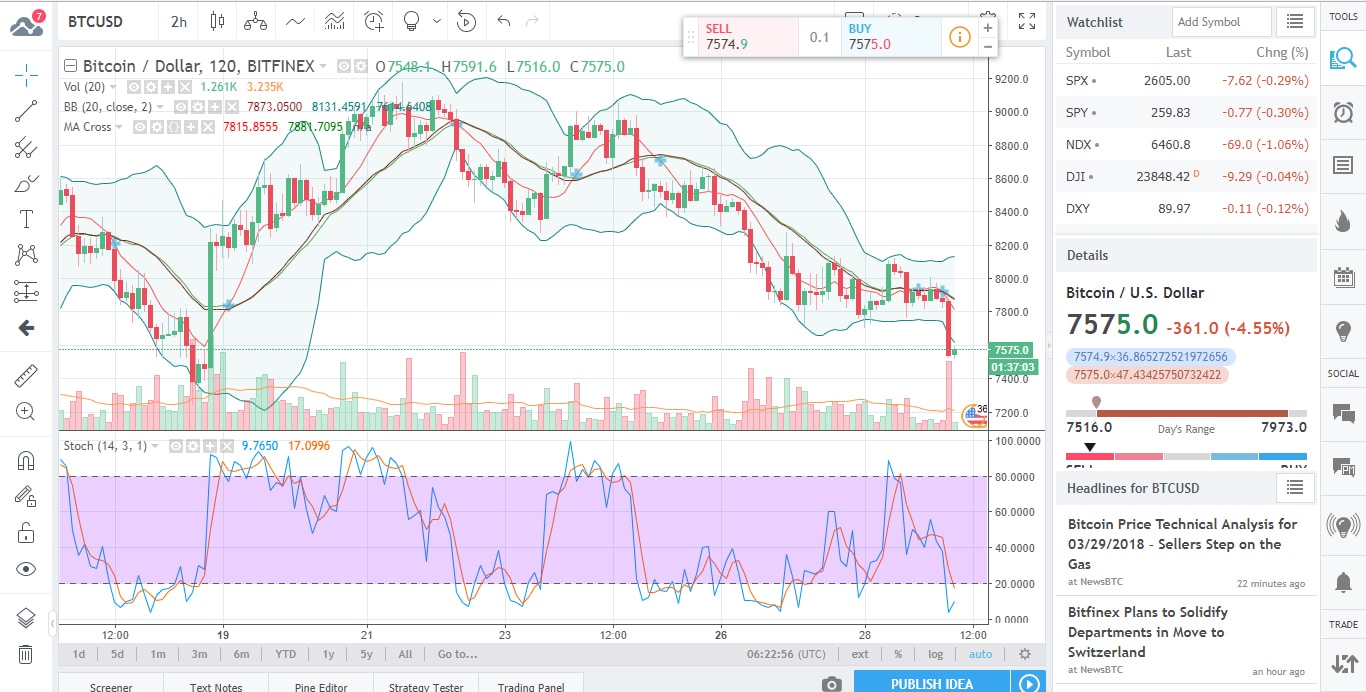
With the majority of technical indicators screaming “Sell”, the stochastic oscillator on the above chart has already entered oversold territory, and its lines – which are about to cross – suggest that the above discussed trend-reversal brought about by the Death Cross, may indeed materialize.
What do fundamentals say though?
Good news on this front have been few and far between lately and we’re looking at a mixed bag in this regard now too.
Lichtenstein is apparently looking to support blockchain through new laws, while taxes which are set to be introduced in Thailand, may spell the end of crypto trading there.
In Japan, two crypto exchanges (Mr. Exchange and Tokyo GateWay) have withdrawn their applications with the FSA, through which they sought to come under the legal umbrella, by securing licenses. This way, these two actors have essentially dropped out of the Japanese crypto picture.
Coindesk tells us that interest in crypto-related jobs has waned lately (as more and more people drop off the bandwagon kick-started by last year’s massive price rally).
In other news: disillusioned with BCH’s lackluster price-performance, many investors may now be considering jumping ship to BTC.

Forextraders' Broker of the Month
BlackBull Markets is a reliable and well-respected trading platform that provides its customers with high-quality access to a wide range of asset groups. The broker is headquartered in New Zealand which explains why it has flown under the radar for a few years but it is a great broker that is now building a global following. The BlackBull Markets site is intuitive and easy to use, making it an ideal choice for beginners.