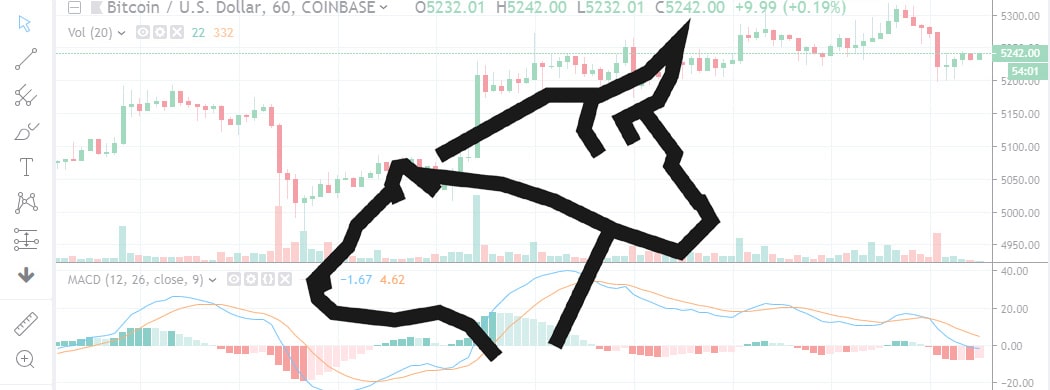
Over the last 24 hours, the price of bitcoin scaled the $5.3k mark for the second time in two weeks. Despite the apparently promising nature of the mini-rally, the bulls ran out of steam above that mark however. The subsequent drop took the price to around $5,230, where it is currently trading. Where do we go from here? Is there any way we could see 6k bitcoin by the end of the month?
Technical analysis may be limited in scope when it comes to the price-prediction of crypto assets such as bitcoin, but when the markets are not ravaged by extreme – and often irrational volatility – it seems to work to some degree.
The current technical picture is clear: the short term (hourly) indicators have turned bearish. The long term picture however, has remained bullish. In fact, a major lagging technical indicator has turned green, in a pattern reminiscent of how it behaved just prior to the beginning of the 2015 bull run.
- with the bullish picture intact, reaching the $6k mark is indeed still possible over the next couple of weeks.
- before that, the immediate target for the bulls is the $5.4k level.
- the bears might drag the price down to the support level of $5.2k over the short run.
- a drop all the way to 5k is possible even, though this price-level has fashioned itself into a sturdy support that is unlikely to yield.
Long term bulls rule
The lagging indicator that has turned bullish for the first time since February 2018, is none other than the 2-week MACD. On one hand, the Moving Average Convergence Divergence indicator is a widely followed technical artifice. It did indeed successfully predict the start of the bull run which culminated in 2017’s $20k all-time peak.
The problem with it is that its utility in regards to price prediction is limited at best. It lags the price and the longer the time frame it spans, the more it does so. Whatever legitimacy it presents in this instance stems entirely from historical considerations, and we all know the prediction-wise value of past data…
Whatever significance we attribute to it however, the 2-week MACD is yet another addition to a growing menagerie of bullish hints on bitcoin.
The short term bearish case
As mentioned, the hourly chart paints a rather different picture. The RSI in particular has been drawing lower and lower highs. The MACD has also dipped below zero, into red territory.
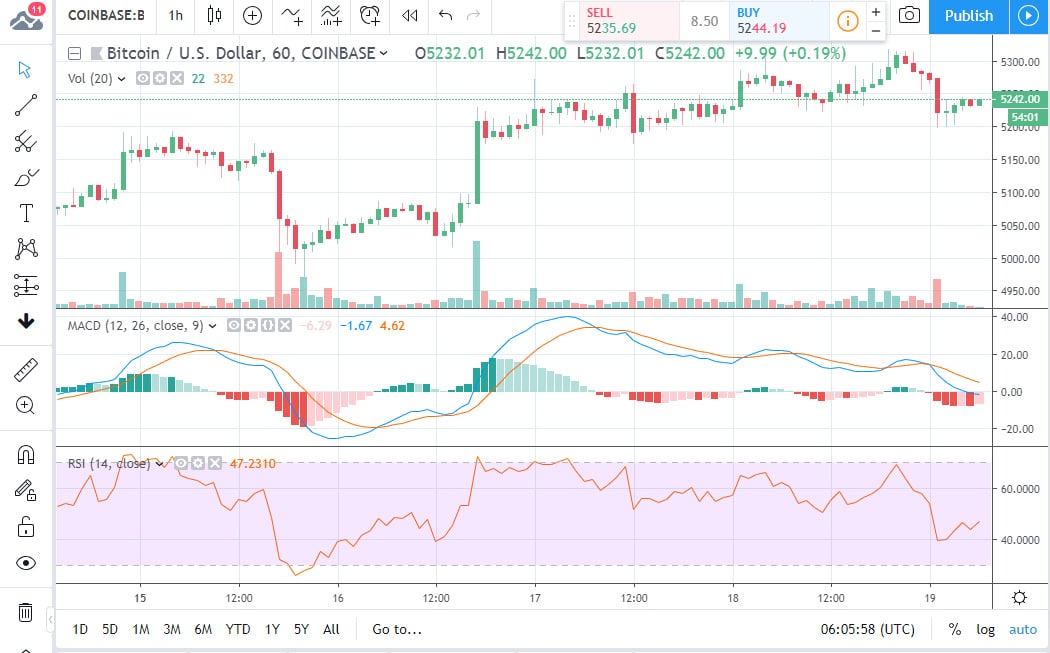
The precise location of the first strong support the bears will have to tackle is $5,192. The price has already bounced from this level a couple of times.
Falling below this level would see the price complete a bearish head-and-shoulders pattern on the 4h chart, the neckline support of which would be located at the $5k mark.
What do the fundamentals tell us?
bitcoin’s transaction fees have gone up, logging yearly highs around $1-$2. The spike coincided with the price rebound and consolidation we have witnessed over the last couple of months.
Fees are part and parcel of the bitcoin experience, and as interest spikes in blockchain and bitcoin, bringing with it increased on-chain activity, fees will inevitably rise.
Binance has made headlines this week due to its decision to delist the controversial SV version of BCH. The move was widely seen as a major vote of confidence granted to bitcoin. It also cleaned up a mess that has been the bane and shame of the industry for some time.
The crypto heavyweight now plans to launch a fiat-to-bitcoin exchange in Singapore next week.

Forextraders' Broker of the Month
BlackBull Markets is a reliable and well-respected trading platform that provides its customers with high-quality access to a wide range of asset groups. The broker is headquartered in New Zealand which explains why it has flown under the radar for a few years but it is a great broker that is now building a global following. The BlackBull Markets site is intuitive and easy to use, making it an ideal choice for beginners.