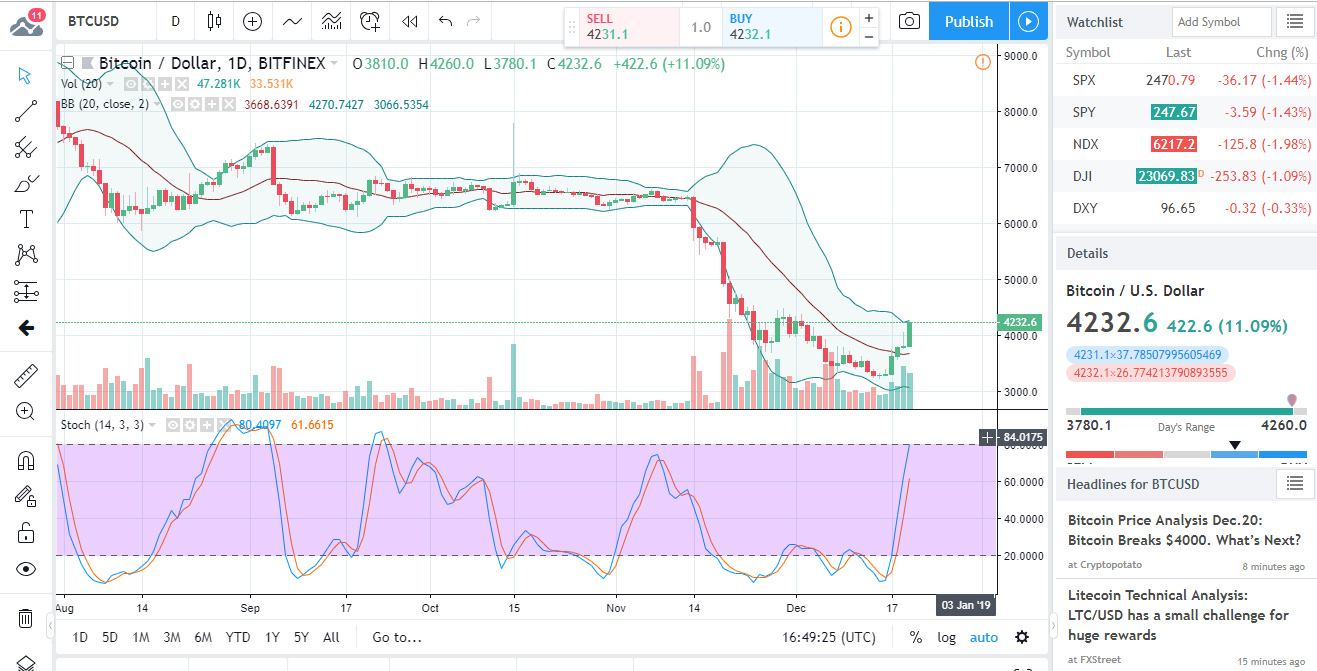
The world’s top cryptocurrency by capitalization went through lots of woe lately, but over the last handful of days, it has moved up, past the psychological resistance of $4,000. While even at the time of writing, it continues to teeter around $4k, its hold on the current situation seems quite tenuous at best.
Is this the end of the bear market, or is it nothing more than yet another bull trap?
BTC’s move above the $4k level (earlier today, it did in fact hit its two-week high of $4,108), came as a little bit of a surprise, and despite the fact that nothing seems to point to this occurrence as the possible trigger of the next sustained bull run, many analysts got carried away instantly, claiming/hoping it would turn out to be just that.
Wishful thinking aside, over the last couple of hours, $4k has begun acting as a support level, bouncing the price repeatedly, so it does look like the current situation is indeed a little bull-biased.
Furthermore, also underscoring the sustainability of the current situation, is the fact that the move above $4k was a high-volume thrust. Indeed, the 24h trading volume registered a one-month high above the $8 billion mark.
What scenario is likely though, if we do indeed see the bulls flex their muscles, carrying the price towards the next hurdle of $5k?
Several resistance levels are within reach. On the daily chart, the $4,402 price-level is where the 50-day EMA is currently located. This could turn into a formidable obstacle.
The bearish lower price high of November 29 is also around the same area, at $4,410.
At $4,430,we have the Fibonacci retracement of 38.2 percent, of the drop from November 7 to December 15.
All this makes the area just above $4.4k extremely treacherous for the bulls. To add to their woes, the RSI now shows overbought conditions already. What this means is that the price is not likely to break through that resistance area any time soon. In fact – when the time comes – several attempts may be required to overcome this hurdle.
On the flipside, once this resistance level is overcome, the price is likely to climb all the way to $5k relatively quickly.
First though, it needs to get to $4.4k, and for that, it needs to keep above $4k for now, or more precisely above $3,924 – which is last Wednesday’s high. A drop below that mark followed by another slide towards the $3.6k area, would completely smoke out the bulls from the setup, handing the reins of the price action right back to the still-menacing bears.
From a strictly technical perspective, the oscillators are neutral right now. The MAs on the other hand are quite buy-biased, with 10 of them pointing to Buy, against 6 pointing to Sell.
As far as the fundamentals go, perhaps the most interesting bit of news is that famed BTC shorter, Mark Dow decided to finally close the trade he had opened last December, at the height of the 2017 BTC frenzy.
Dow apparently took profits twice this year on the decline. He was among the first to make use of the newly launched futures in December, reaping massive dividends off his bets against bitcoin.
A former IMF economist, Dow is far from being a BTC bull, even now. The reason behind his decision to say goodbye to his short position was that he apparently didn’t feel like “riding this thing to zero”. He also said he did not want to squeeze any more juice out of this lemon…

Forextraders' Broker of the Month
BlackBull Markets is a reliable and well-respected trading platform that provides its customers with high-quality access to a wide range of asset groups. The broker is headquartered in New Zealand which explains why it has flown under the radar for a few years but it is a great broker that is now building a global following. The BlackBull Markets site is intuitive and easy to use, making it an ideal choice for beginners.