Over the last few days, BTC, the world’s premier cryptocurrency, has been trading mostly sideways, in confirmation of a longer-term trend, which started as early as the beginning of September. The way things are shaping up right now, both from a technical and fundamental perspective, we are about to see more of this same sideways trading. Some seem to believe though that we’re on the eve of a major price explosion.
What is the current situation from a technical perspective? The BTC bears have repeatedly bounced from the ascending support level drawn from September 8 – clearly visible on the daily chart. That said, a very strong resistance was put in place around the $6.8k mark. Indeed, today at least, the price has failed to break past $6.6k- currently trading at $6.576.
While the ascending support level mentioned above does not look bad from the perspective of the bulls, the currently reigning bias is still a bearish one – indicating that the path of least resistance is now downward.
The tightening trading range also heralds some sort of a breakout which – the above taken into account – is likely to take the price downward.
The strong resistance alluded to above is defined by the 50-Day MA, and it is located around $6,850.
In addition to the above mentioned bearish indicators, the MACD is on the verge of executing a bearish cross as well.
The 4-hour chart shows further obstacles in the path of an upward move too, the bottom line being that the price is stuck within the Bollinger Bands for now.
What that means is that the immediate outlook is indeed neutral, and the most likely course forward is continued range-bound trading.
To break out upwards, the price needs to break above the $6.8k mark in the short-term, defined by the Bollinger Bands. Anything short of that will keep the currently undecided status-quo in place, or worse: send the price southward.
If – however unlikely – such an upward breakout did happen, its immediate target would be the $7,429 mark.
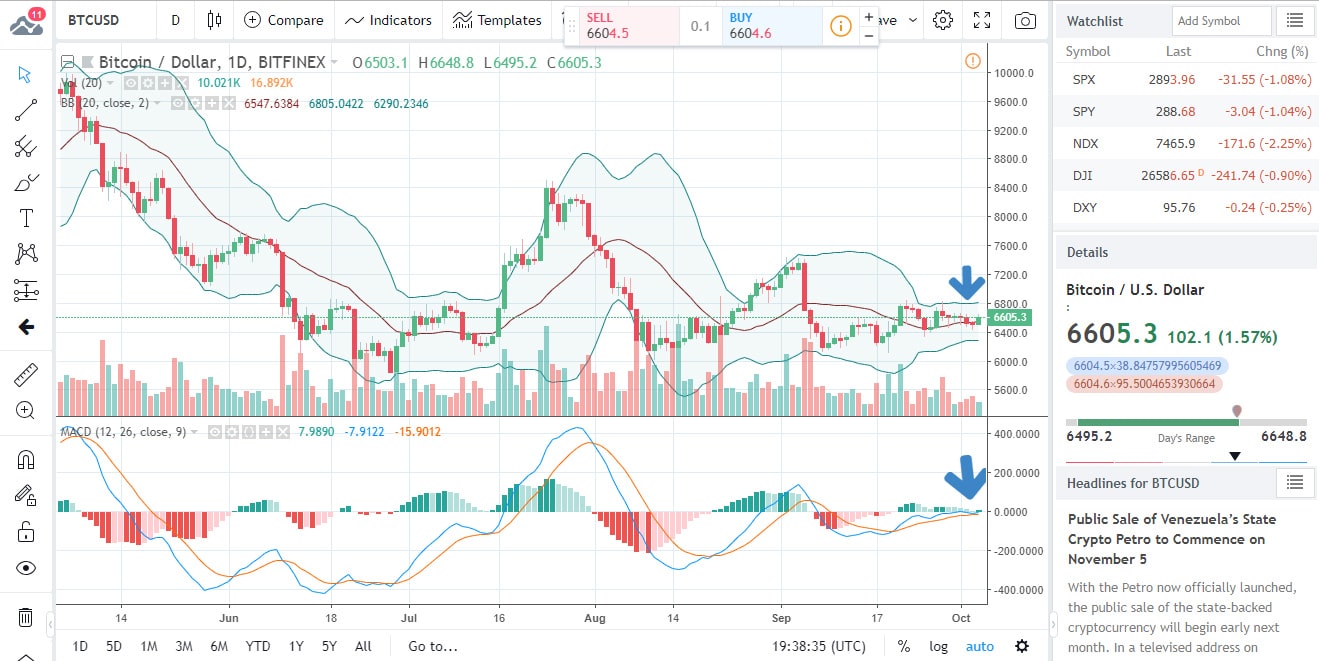
As said above, it is much more likely the bears will find some strength though. If the price broke below the $6,290 mark, defined by the lower Bollinger band, the drop would resume, and the $5,755 July low may indeed be revisited.
What does the bird’s eye view of the technical picture say though? Interestingly, for the first time in quite while, the indicators say Buy. More precisely: the MAs do. The oscillators – like the current price outlook – are undecided.
The Momentum says Sell and the MACD says Buy, but the other 9 oscillators are neutral.
Some 8 MAs say Buy though and 6 say Sell. Only the Ichimoku Cloud Base Line is undecided.
What about the fundamentals? Lately, there has been no shortage of potentially price-moving news, though it is safe to say that nothing really managed to break the bull/bear deadlock.
The EU’s financial markets supervisor, ESMA, has made it its goal to monitor cryptos in 2019. To this end, the organization has set aside some EUR 1 million. According to the ESMA, this supervision will mostly consists of actively looking for risks and issues concerning crypto-related activities.
In other news: according to the US Government, Russian intelligence apparently used Bitcoin to fund a disinformation campaign. The conspirators named in a recently-published indictment allegedly made use of Bitcoin to pay for a range of servers and web domains used for their goals.
Although USD was also used in the alleged activity, the indictment saw it fit to cast more negative light on BTC and its semi anonymity-linked peculiarities.

Forextraders' Broker of the Month
BlackBull Markets is a reliable and well-respected trading platform that provides its customers with high-quality access to a wide range of asset groups. The broker is headquartered in New Zealand which explains why it has flown under the radar for a few years but it is a great broker that is now building a global following. The BlackBull Markets site is intuitive and easy to use, making it an ideal choice for beginners.