The fortunes of the Bitcoin bulls have been well and truly reversed over the last couple of weeks. With the April 17 tax deadline behind us, people are apparently no longer keen on selling their cryptos for fiat. Obviously though, the factors behind this – rather sustained – rally, are far more complex than that. Will BTC revisit the $10k mark this month? Technical analysis says it is certainly a possibility…
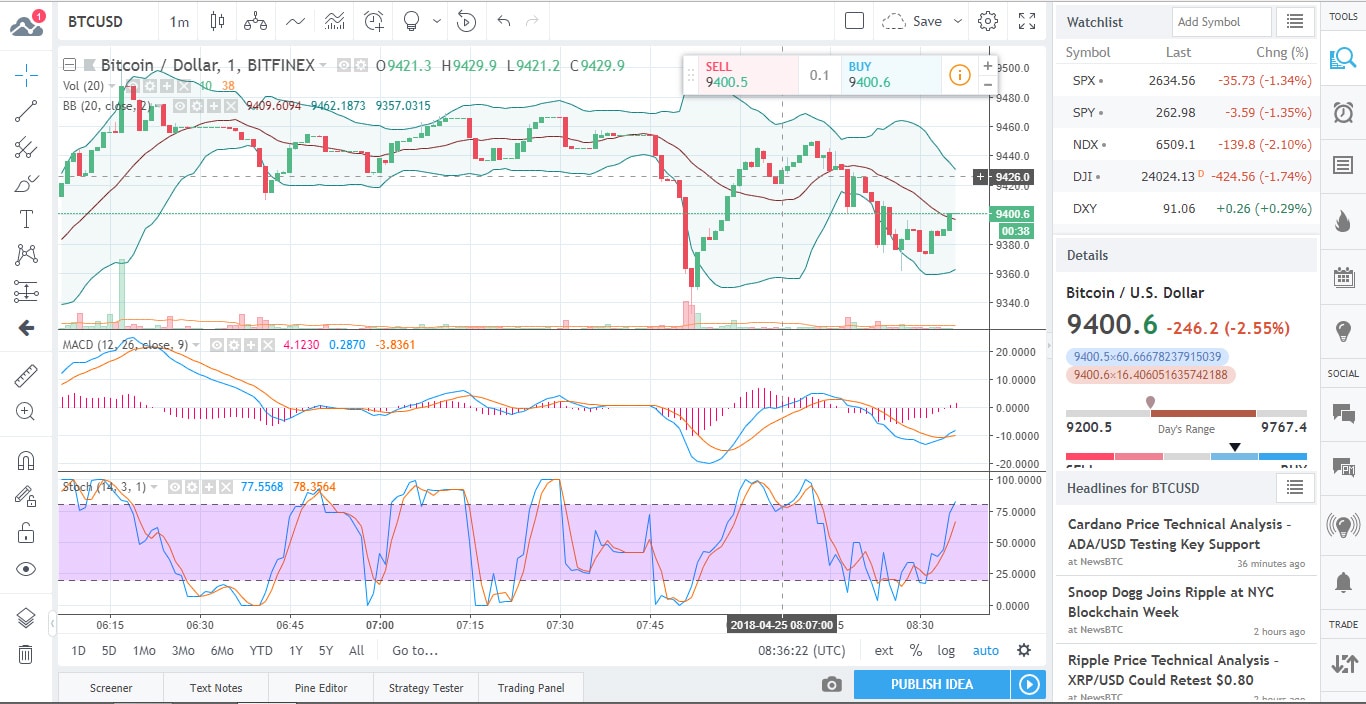
Shortly after midnight (UTC) on Tuesday, BTC hit and then surpassed the $9.3k mark, against the backdrop of solid trading volumes. The price level last saw this mark on March 14. Since Tuesday though, this new more-than-one-month maximum has been surpassed as well. BTC is now trading at $9.44k, and there are indeed no signs of bull exhaustion on the horizon. Why can we be so certain of that? With the long-term descending trend line in the dust and the daily RSI firmly in bullish territory, the outlook is quite bullish indeed. So much so in fact, that we may yet see the $10k psychological resistance level surpassed this month.
The road to that point is fraught with at least one more hurdle though, currently located at the $9.8k mark. On Tuesday, the daily chart defined two resistance levels deemed significant enough: one at $9,280 and another at 9,800. While the former is already in the rearview mirror, it is worth taking a closer look at how these resistance levels were determined.
The $9,280 level represented the Fibonacci retracement of 23.6, of the drop the price went through between December 17, 2017 and February 6, 2018. The 9,800 level on the other hand is set by the 200-day MA, which is a bit more solid in our book.
In addition to these resistance levels, overbought conditions are indicated by the 4h and 60-minute RSIs.
Those who like to keep their eyes on the minute-by-minute evolution of the price, will notice that the stochastic oscillator seems headed into overbought territory as well, though it has not quite made it there yet. On the 4h chart, this is hardly the case though, while on the 1-day chart, the stochastic is firmly entrenched in overbought territory and its lines have indeed crossed as well.
While the oscillators are currently hovering about in neutral territory (5 of them are neutral, 3 say “Sell” and 3 point to “Buy”), the Moving Averages are strongly “buy”-biased. 12 of them are screaming “Buy”, while only 2 point to sell (these 2 are the Simple MA (200) and the Hull MA (9)).
What do the news say though? Is this bull-run backed by anything in the realm of fundamentals?
The news coming out of various crypto-portals are mostly neutral, which means that there is something fundamentally more substantial driving the current rally.
The perpetrator of Iceland’s Big Bitcoin Heist has apparently been apprehended in Amsterdam. Sindri Thor Stefansson made off with some $2 million in BTC mining hardware. Imprisoned in Iceland, he simply walked out of a low-security prison last week, making it to mainland Europe before being arrested. It now looks like he will be extradited back to Iceland, though apparently he actually wants to return too, and he has been negotiating with police in this regard.
The hardware he has allegedly stolen has not been found yet.
In other news: hot on the heels of BTC’s latest rally, BCH mounted quite a price-explosion of its own. Hitting $1,575 at one point, the price has undergone a bit of a correction already, trading at $1,314 right now. To remain within the bullish zone, BCH needs to stay above the $1,350 support level.

Forextraders' Broker of the Month
BlackBull Markets is a reliable and well-respected trading platform that provides its customers with high-quality access to a wide range of asset groups. The broker is headquartered in New Zealand which explains why it has flown under the radar for a few years but it is a great broker that is now building a global following. The BlackBull Markets site is intuitive and easy to use, making it an ideal choice for beginners.