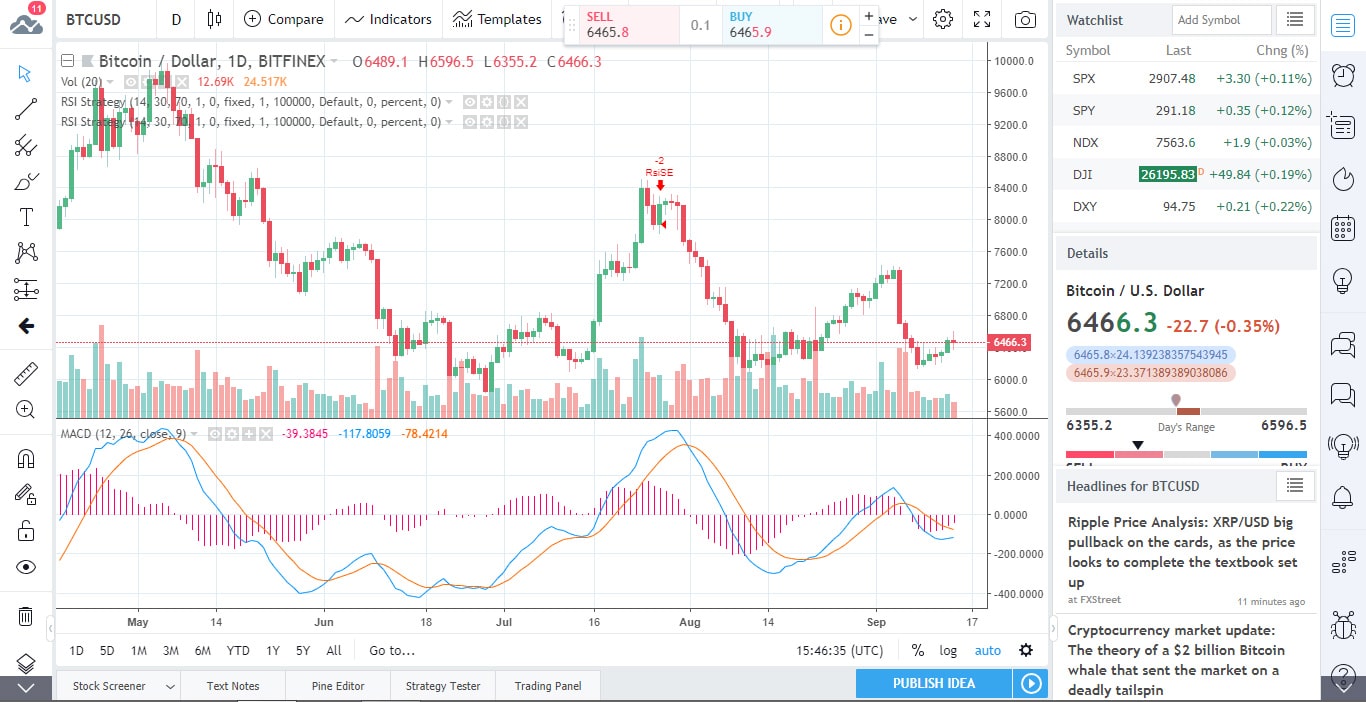
These days, the world’s biggest cryptocurrency by market-cap, Bitcoin, really does not seem to be able to catch a break. About a week ago, technical analysis pointed at the $6.4k resistance level as the mark to beat, to curb the voracious appetite of the bears. Sure enough, the price of BTC conquered that level and it started heading upward according to the predictions, but then, it took another unexpected $200 tumble, which brought it back just above $6.4k.
Bitcoin bulls do indeed seem to be working against the tide nowadays: whenever they manage to tediously push the price upward by a more or less significant margin, the bears strike right back, and bring it all back down within a few minutes. While the floor hasn’t really dropped out from under the price yet, BTC seems to be having a hard time making any kind of headway.
Despite the overall disheartening picture (from the point of view of HODLers and bulls of course), technical analysis seems to point to the fact that the current pullback is nothing more than the herald of a period of healthy consolidation, before the bulls take over again and push the price back up above $6.5k. Indeed, according to technical analysis, the path of least resistance continues to be upward, despite the recent water-treading woes.
Why is that the case though? The MAs (the 50-hour, the 100-hour and the 200-hour ones) are all trending upward on the 1-hour chart and they have acted as support levels, even for the current price-drop.
About how far north does this currently bullish setup point though? The target is the $6.8k mark, defined by the recent multiple daily highs.
The MAs display a bearish bias on the daily chart too. For instance, the price ended up above the 10-day MA yesterday, curbing the bearish outlook ushered in by the breaking of a rising wedge chart-pattern that had happened earlier in the month, when a sudden drop put an end to the latest sustained price-rally.
That said, there are a few bearish factors in play as well. Sticking to the daily chart: the above said 10-day MA is still pointing downward and the RSI on the hourly chart is still decidedly bearish. This may be enough to keep the price in water-treading mode for at least 24 more hours.
That said, the overall technical picture has most of the indicators pointing to Sell. This Sell-bias is obvious in regards to the MA’s, no fewer than 12 of which point in this direction.
The oscillators offer a much more balanced picture, or maybe they’re just “confused”. Some 9 of them are neutral, with one pointing to Sell and one to Buy.
What about the fundamentals though? In times of range-bound trading, they can truly step up to lend a push to the bears or the bulls.
The problem is that these days, the fundamentals are rather mellow as well. Obviously, there are all sorts of news breaking, regarding various crypto- and blockchain-related developments, but none of them seem to carry the kind of weight that can trigger a price-movement in either direction.
The SEC is apparently done denying various BTC ETF initiatives for the time being, and the ICE’s Bakkt is way too far off to mean anything fundamentals-wise.
Other than that, the ECB’s Mario Draghi has announced that there are currently no plans drawn up for the launching of a “digital Euro”. Justifying his stance on the matter, he brought up physical cash use across the EU and the allegedly flimsy nature of the currently available technology.
In other news: ETH trading volumes have exploded, registering a 12-month high on Thursday.

Forextraders' Broker of the Month
BlackBull Markets is a reliable and well-respected trading platform that provides its customers with high-quality access to a wide range of asset groups. The broker is headquartered in New Zealand which explains why it has flown under the radar for a few years but it is a great broker that is now building a global following. The BlackBull Markets site is intuitive and easy to use, making it an ideal choice for beginners.