Over the last few days, the price of BTC went through a real massacre. It has dropped below the $6k mark which it had managed to defend several times in the near-past, and analysts say that this move opens the door for still more losses, as it signals the breaching of a key support level. How far is this nearing price drop likely to take BTC? Will new 2018 lows be set?
The price of the most popular cryptocurrency, Bitcoin, looked set to trigger a corrective mini-rally yesterday, but eventually, that rally turned into a rout and instead of advancing towards $7,000, it retreated well below $6,000.
At this point, it is indeed easy to see why HODLers who bought in at $17,000 and $13,000 might feel like they’re watching a train wreck in slow motion.
Currently trading at $5,888, the cryptocurrency saw a low of $5,755 at one point. This drop below $6,000 carries quite a bit of significance indeed, strengthening the hand of the bears.
The last few weeks and even months provided plenty of testimony to the strength of this support level. Now that we’re looking up at it, we might indeed be just a handful of closes away from this mark turning into a resistance – just as formidable.
According to technical analysis, such a turn of events is also likely to push the price to the $5,000 level, in the short-run.
The alarming thing for crypto enthusiasts is however that – despite its losses – BTC is still outperforming most other cryptos today. Indeed, everything is in the red across the board, as people are scrambling to move money out of altcoins and into BTC.
Why does BTC still drop then though? Apparently, those moving their money from altcoins to BTC do not linger around: they cash out, causing the current selling spree, which has indeed landed the asset deep in oversold territory.
As far as technical analysis is concerned, there is no denying the fact that the price of BTC is stuck in a falling channel (defined by ever lower lows and ever lower highs).
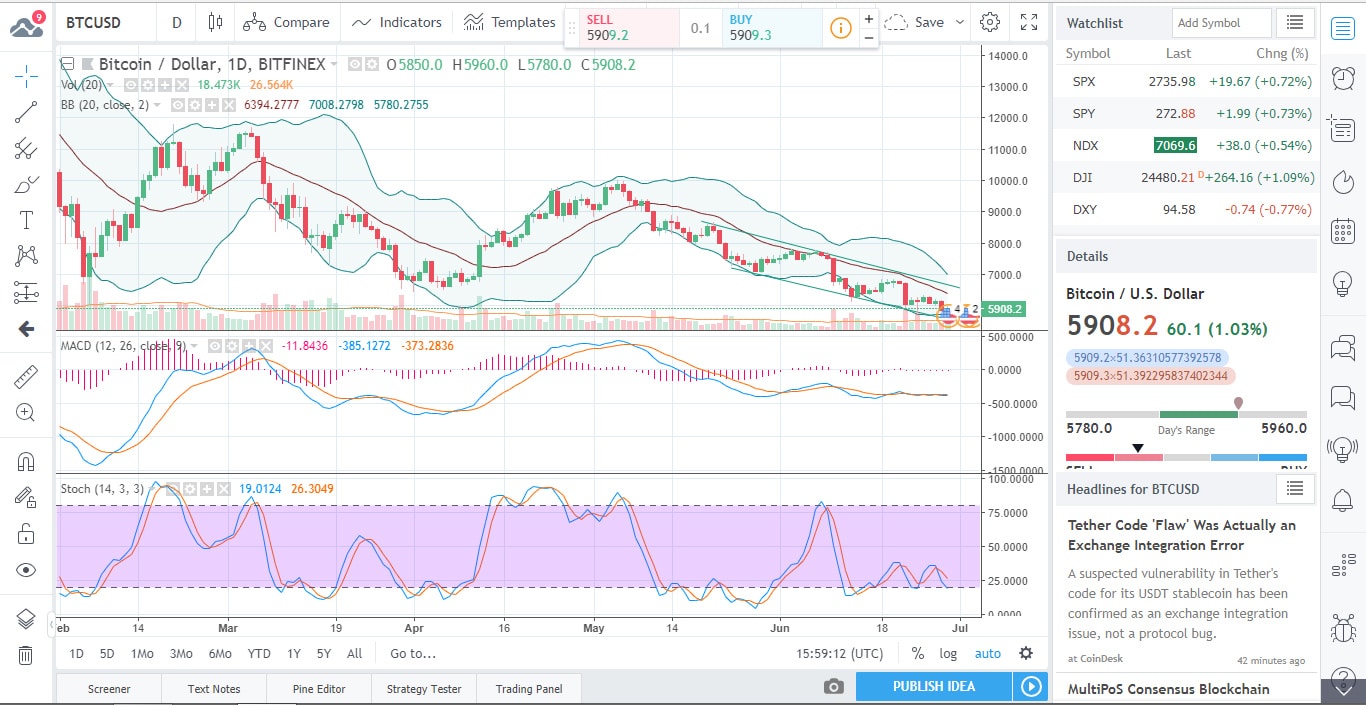
On the 1-day chart, the 5-day and 10-day MAs are also sloping downward, but we haven’t even begun to scratch the surface of the plethora of bearish indicators.
The CMF (Chaikin Money Flow) oscillator is also in negative territory, and it has been there for more than 5 weeks now.
All the above means that both the short- and the long term outlooks are bearish. The immediate low to watch is the $5,755 level, but further downward motion is still in the picture, all the way to $5,400.
Below that point, the road is more or less open to $5k.
Above, we mentioned the falling channel: a break upward from this channel might signal a bearish-to-bullish trend-reversal, though – as also pointed out above – such a move is not very likely.
While the oscillators paint a neutral picture for the time being, the MAs are very Sell-biased. Some 14 of them point to Sell and none to Buy.
What about the fundamentals though?
They haven’t really been a merry bunch lately – to say the least. Over the last couple of days, two major exchanges got pretty much expelled from Japan, and buy volume has been decreasing significantly.
News broke about the Feds investigating some 130 crypto crimes and the Bank of England decided to issue a fresh round of crypto-warnings.
To add insult to injury, Bitfinex began having problems with fiat deposits too.
A short story even shorter: it’s safe to say crypto can’t really catch a proper break these days…

Forextraders' Broker of the Month
BlackBull Markets is a reliable and well-respected trading platform that provides its customers with high-quality access to a wide range of asset groups. The broker is headquartered in New Zealand which explains why it has flown under the radar for a few years but it is a great broker that is now building a global following. The BlackBull Markets site is intuitive and easy to use, making it an ideal choice for beginners.