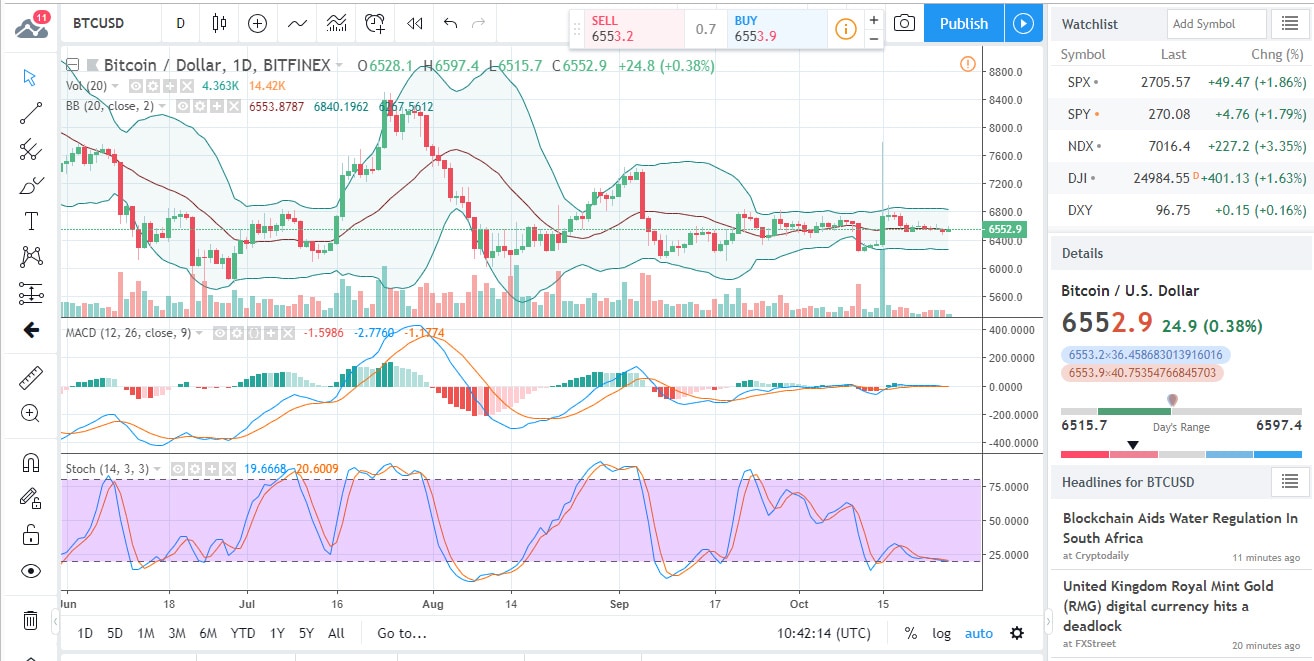
It is not a secret to anyone that the price of BTC, the world’s premier cryptocurrency, has been struggling to gain any kind of traction lately. With the bulls handily kept at bay, the bears failed to vault to the forefront too, leaving the crypto blue-chip floating about seemingly aimlessly, in a rather narrow range between $6,370 and $6,470. Where do we go from here?
No matter how we turn this one around, there’s no escaping the cold-hard truth that BTC’s current “indecision” is due to the fact that it has failed to rustle up buyers. Indeed, technical analysis pointed to an imminent bullish breakout, and after an important trend-line resistance was successfully cleared, it looked like that breakout would indeed take shape.
The said trend-line resistance was defined by the July 25 and September 4 highs, and indeed, it has been cleared without problems, though it being a downward-sloping trend-line, the price didn’t actually have to rise to beat it.
In order for the bullish reversal to be confirmed, a clean break above the $6.8k level would’ve been needed, and that did not come to fruition. Since the price is still above the said trend line though and below the $6.8k mark, it may still head upward at some point and break through.
If and when that happens, we’re looking at a possible rally all the way to $7.4k.
The 4-hour chart makes it clear that we’re dealing with a tightening trading range yet again – another indicator of an imminent breakout.
This breakout may turn out to be a downward one as well though. If the price drops below $6,376, we’re looking at a revival of the bearish bias, which may take the price all the way down to $6,121, the next major support level, defined by the 21 month EMA.
Thus far however, the price successfully defended the $6,376 support, which means that an upward breakout from the current stalemate is the more likely.
Despite that, the bird’s eye view of the technical picture still points to Sell. The MAs are very Sell-biased indeed: some 12 of them point to Sell, while only 2, the Simple MA and the Hull MA, point to Buy.
The Oscillators are much less categorical in this regard: 8 of them are neutral and 2 of them point to Sell, while only one, the Momentum oscillator, points to Buy.
What do the fundamentals say though?
In all honesty, the fundamentals – mostly driven by the currently ongoing stock market breakdown – do not make much sense.
Traditionally, in the past, risk-aversion in the stock market drove investors to cryptos in general and BTC in particular. This time around, that does not seem to be the case, as BTC is still struggling to pick up buyers – as pointed put above – despite the said risk aversion being in full effect.
The news in general tend to be rather positive these days too. ICE have announced a revised launch-date for their Bakkt, now set to December 12. Talk of BTC ETFs has been revived, with industry representatives briefing a new member of the SEC on the finer points of the initiatives currently being considered.
A Chinese arbitration court recently handed down a decision regarding the eligibility of BTC for protection as property. It has to be noted that this decision pretty much flies in the face of the Chinese central bank’s ban on BTC (and crypto) trading.
Long story short: the fundamental picture is favorable. Still, the price refuses to budge upward, but that may not be much more than a prolonged calm before the upcoming storm.
HODLers definitely view this as a great opportunity to stock up on cryptos.

Forextraders' Broker of the Month
BlackBull Markets is a reliable and well-respected trading platform that provides its customers with high-quality access to a wide range of asset groups. The broker is headquartered in New Zealand which explains why it has flown under the radar for a few years but it is a great broker that is now building a global following. The BlackBull Markets site is intuitive and easy to use, making it an ideal choice for beginners.