The price of the world’s top cryptocurrency by market capitalization has not exactly been doing well lately. Every time it seems to mount anything resembling a rally, something pops into the picture that instantly deflates the bulls. The fundamental factor which just accomplished this same feat yesterday, was the hacking of Bithumb, the world’s 6th largest crypto exchange by volume.
Although Bitcoin’s latest correction-rally had seemingly run out of steam well below the $7k mark, before news came in about the Bithumb hack, this latest “bundle of joy” put the nails well and truly into the coffin of the BTC bulls – at least from the perspective of casual observers. Did it really though?
Indeed, as an immediate consequence of the dire news, the price dropped from $6,740 to $6,560, but it recovered in short order, and it is currently trading at $6,752, seemingly having resumed its march towards the much-anticipated $7,000 mark.
Did BTC just shrug off the theft of some $32 million in crypto assets from Bithumb? It sure looks that way…for some reason, the BTC bulls found this piece of news a cinch to swallow, and the rally – pretty much compromised even half a day ago – is now back on, full steam ahead.
What exactly is going on in technical terms here?
There is simply no way around the fact that the technical charts show a bullish bias, one that seems to have prevailed over the bearish fundamentals. On the 4-hour chart, the 50-MA has formed a support level, which has indeed prevented the price from dropping lower than $6.5k. In fact, that level was only briefly approached.
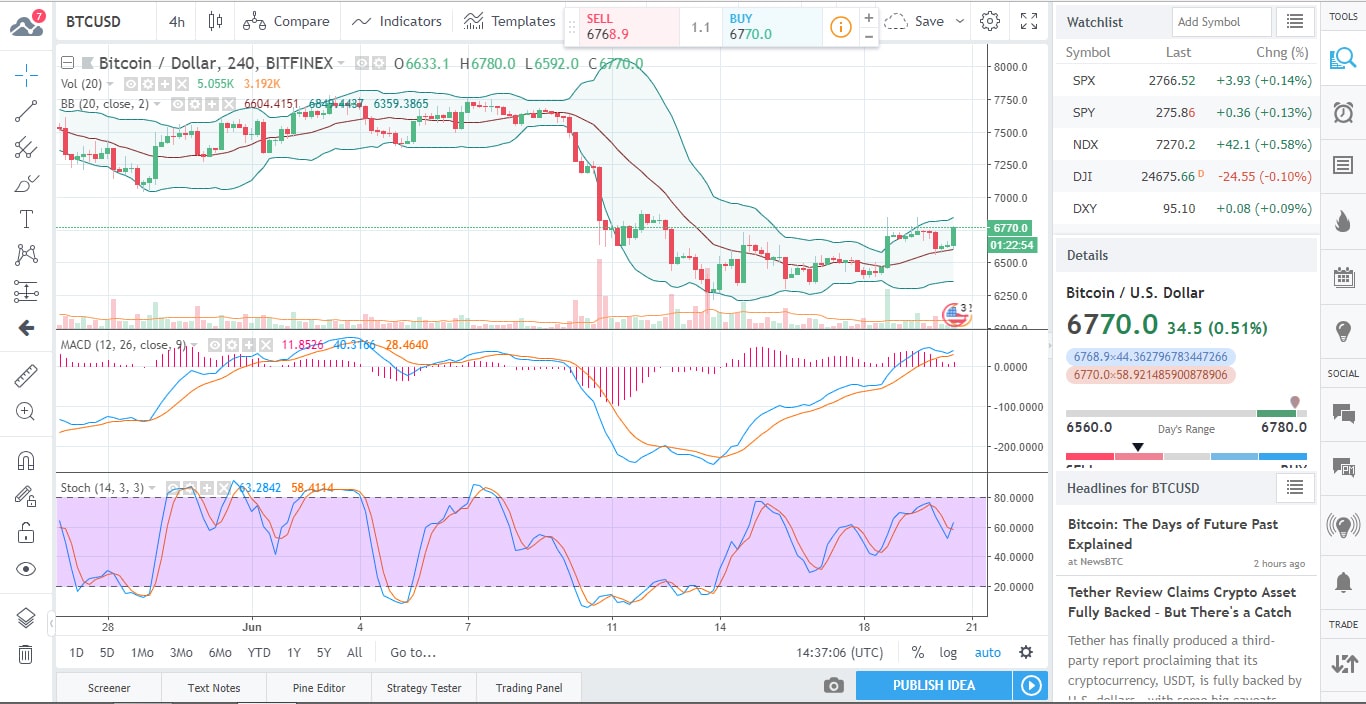
Furthermore, even without it being drawn in, it is obvious from the chart above that we are looking at a rounding bottom pattern – a bullish reversal pattern valid for the last 10 days. Further compounding the case of the bulls, there was a Bollinger band breakout and the RSI has held fast above 50.
The indicator to watch is the ascending trend-line. A break below this level would indeed signal the onset of yet another bearish reversal.
The daily chart gives out a short-term bullish vibe as well, through the crossing of the 5-day and 10-day MAs.
Despite all the above, the oscillators only point to a “neutral” conclusion, with the Momentum one giving a “sell” signal, while the MACD Level says “Buy”. All the others are neutral.
The MAs on the other hand, are quite categorical in their verdict: strong sell. 11 of them point to sell and only 3 to buy.
So what is the short-term outlook? Assuming the bulls will indeed take over, the $7,024 mark is the resistance level to watch. It is the 23.6 Fibonacci retracement, covering the full range of the latest price-drop from $9,990 to $6,108. Going above that level would open up the path all the way to ~$7.6k.
If the price does head downward though, and breaks below $6.5k, the short-term bulls will indeed be defeated for good, opening the way for a drop all the way to $6k and then $5k.
As far as the fundamentals are concerned, the picture is obviously dominated by the above mentioned Bithumb heist, and by the way BTC has thus far shrugged it off without a problem.
Indeed, volume-wise, the hack wasn’t really special. On top of that, Bithumb have already promised to fully reimburse all losses resulting from it. It is therefore safe to say that its overall impact on pushing the negative crypto narrative is a negligible one.
In other news: Goldman Sachs CEO Lloyd Blankfein reiterated his neutral position towards Bitcoin the crypto industry in general.

Forextraders' Broker of the Month
BlackBull Markets is a reliable and well-respected trading platform that provides its customers with high-quality access to a wide range of asset groups. The broker is headquartered in New Zealand which explains why it has flown under the radar for a few years but it is a great broker that is now building a global following. The BlackBull Markets site is intuitive and easy to use, making it an ideal choice for beginners.