Despite yet another half-hearted (and obviously: failed) attempt at mounting a sort of mini-rally, the price of the world’s top cryptocurrency by capitalization has resumed its bearish path today, putting the yearly low of $3,455 right into its crosshairs. What’s next? Will the slide be halted again or are we about to see a break below the psychological $3k level even?
Despite an early 4% rebound from nine-day lows earlier today, BTC’s price fell into the clutches of the bears yet again. The slide has been a somewhat gradual one, but thus far it has seemed increasingly menacing.
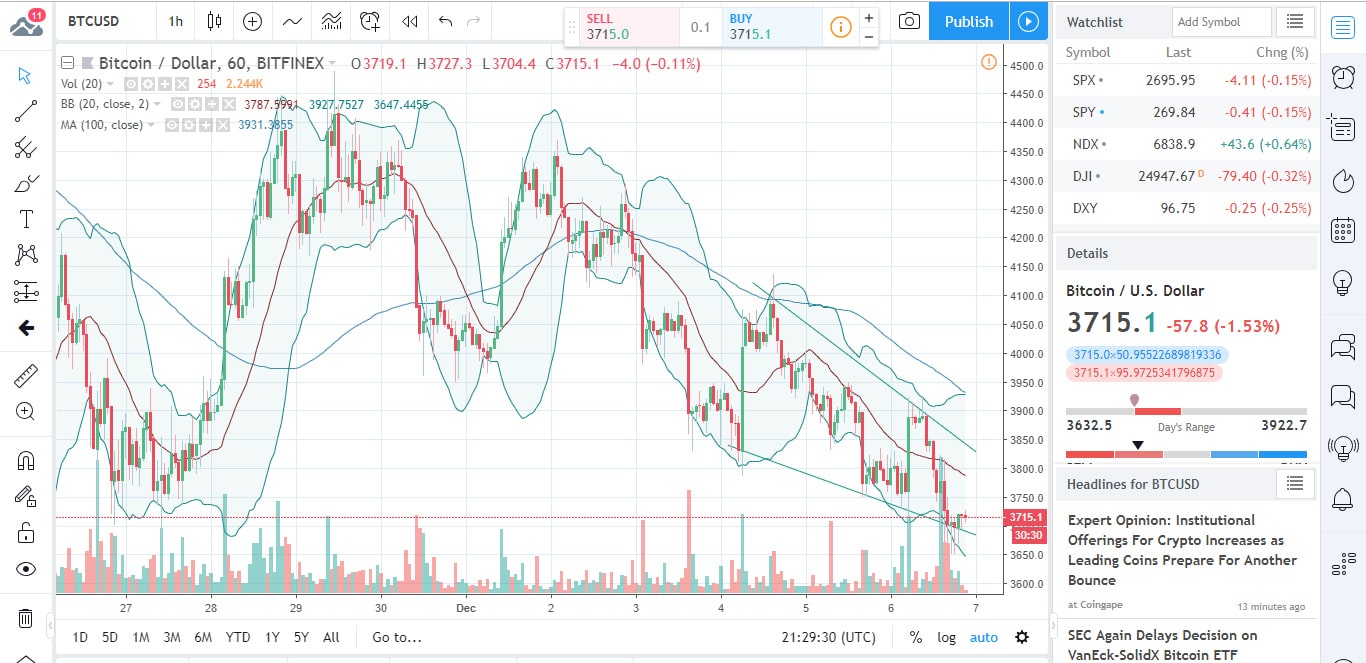
Currently trading at $3,580, it has bounced twice from near the $3.5k level, so we’re clearly dealing with a rather sturdy support there.
On the higher end of the price spectrum, the resistance level is defined by the upper side of the falling wedge pattern visible on the 60-minute chart. This level is $3,882 – currently a rather unrealistic target. If a break above that mark did happen though, the road would be opened up to $4,265 – the December 2 high.
As said, seeing anything bullish develop from this point is highly unlikely though and that’s not just on account of the general market/ press-generated sentiment, which is obviously all negative, but also because most technical indicators say so as well.
The 50-, 100- and 200-hour MAs for instance, are all trending downward.
Chart patterns and other technical factors have become increasingly significant for BTC price analysis, since – during this crypto winter at least – technical analysis has become much more relevant predictions-wise.
Thus, before we even start to think about a sustained bullish reversal, we need to keep an eye on the 10-day EMA, more precisely, we need to see a daily close above that mark. Until that happens, it is safe to say that the bears will remain firmly in charge.
Another indicator that might be relevant in this regard is the above mentioned falling wedge on the hourly chart. An upside breakout from this pattern may indeed result in a bullish reversal as well.
What about the fundamentals though? What do they say in these hard times? Not that it really matters much price action-wise, since the fundamentals do not really seem to elicit any sort of bullish response lately.
On the bearish side however, this could not be further from the truth. When it comes to crypto bears, when it rains it truly does pour…
Apparently, BTC shorts have hit a 6-week high, effectively meaning that more people are betting on further price decline than at any point during the last 6 weeks. The floor has really fallen out from under the price, which to some may indeed mean that it is high-time to buy in.
The general sentiment about BTC has in fact turned so sour that – as pointed out by someone in a comment on some crypto news article somewhere – those holding BTC are no longer keen on letting anyone know about it. A few short months ago, BTC holdings were the stuff of bragging…
On the upside, some actors (large, institutional ones too, like Morgan Creek Digital) still have a great deal of faith invested in the crypto scene. The aforementioned asset manager is willing to put $1 million on the line as part of a bet that cryptos will outperform the S&P 500 in the next 10 years.
The proposed wager is obviously inspired by the famous Warren Buffet bet, which saw the billionaire bet $1million in 2008, that the S&P 500 would outperform hedge funds.
Buffet won that bet.

Forextraders' Broker of the Month
BlackBull Markets is a reliable and well-respected trading platform that provides its customers with high-quality access to a wide range of asset groups. The broker is headquartered in New Zealand which explains why it has flown under the radar for a few years but it is a great broker that is now building a global following. The BlackBull Markets site is intuitive and easy to use, making it an ideal choice for beginners.