Zooming out a bit TA-wise in a bid to find something that has accompanied the current, more than year-long BTC (and crypto) bear market, makes perfect sense. By locating one such indicator, one can possibly pinpoint the bull market reversal everyone is hoping for.
That indicator, on the weekly chart, may just be the 10-week SMA, the evolution of which has thus far pretty much mirrored the bear market and its shenanigans, that resulted in the shedding of some 70% of BTC’s value/market cap.
To find an indicator which defines a trend as long as the current bear market, one has to go to a longer time-frame chart, and the weekly one fits the bill perfectly.
As soon as the 10-week SMA is visualized on it, something rather interesting – to say the least – materializes. Apparently, the 10-week SMA has thus far acted as a formidable resistance level for the price of the top cryptocurrency, never really allowing it to slip its bearish grasp.
This “domination” of the 10-week SMA as resistance was most obvious during the 8 weeks that followed the drop of the price to below-6k territory, but it had certainly been there before too.
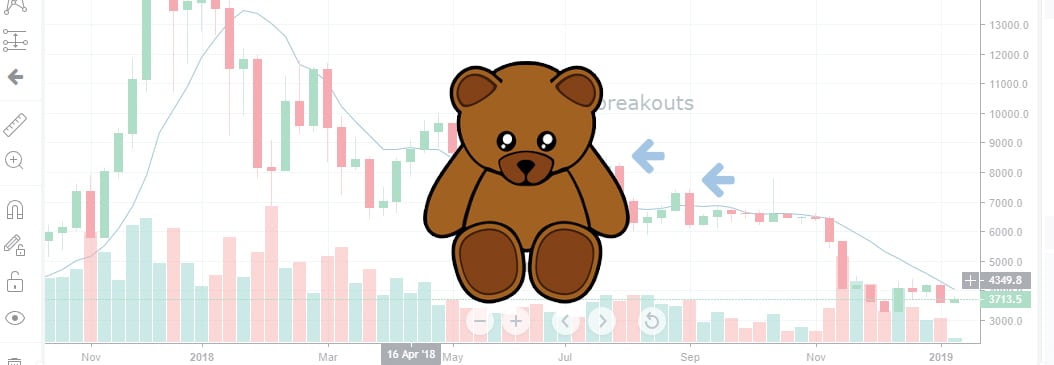
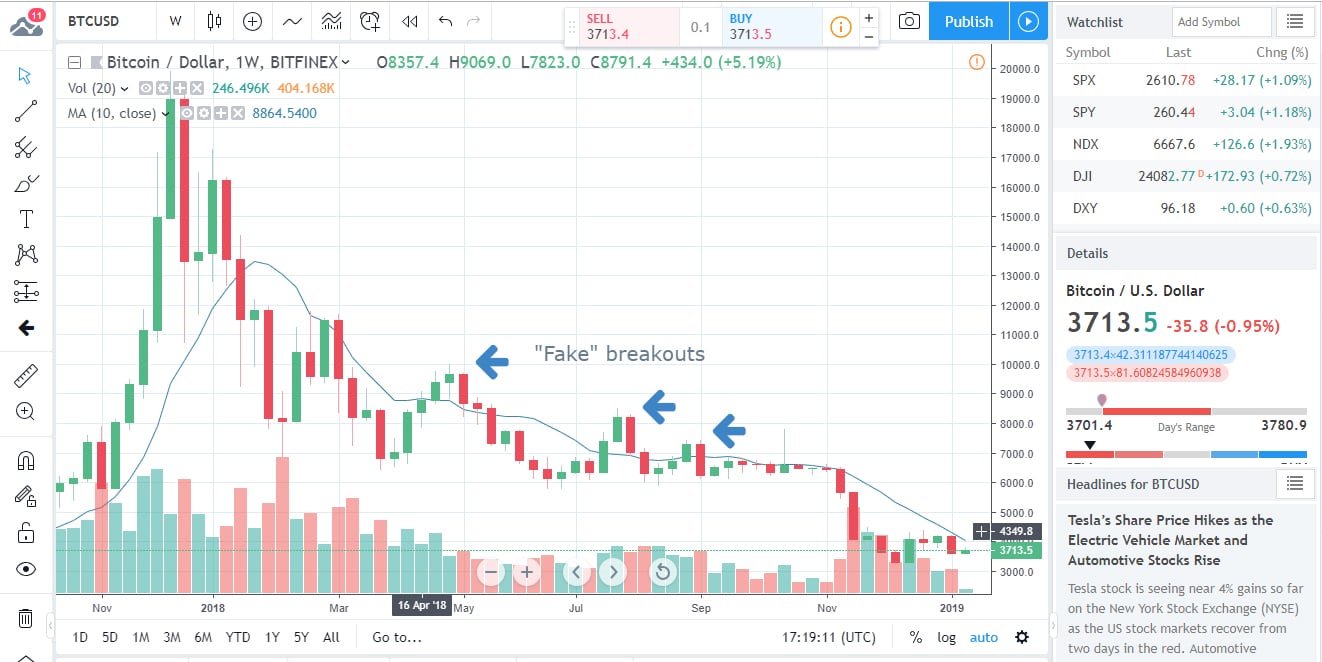
From the start of the bear market a little over a year ago, the price sought to break through the 10-week SMA several times, and though it succeeded no fewer than 4 times, the drag of the resistance level turned out to be too much to overcome.
Two such attempts were registered in the last weeks of February and April, followed by two more in July and August. Every time, the bulls ended up falling into a trap, as the almighty 10-week SMA asserted its dominance.
Long story short: a convincing break above this resistance level (which is currently sitting at the $3,919 mark) will signal the breaking of the trend that has prevailed over the past 13 months. More precisely: it may signal the end of the bear market and its reversal into a bull one.
What exactly does a “convincing breakout” look like though?
In strictly technical terms, a “convincing” break past the 10-week SMA would mean a break past the 21-month EMA, which is currently located at $5.4k.
On the weekly charts, such a breakout would take the shape of at least 4 consecutive weekly candles, that are above the average.
The bad news is therefore that as long as the price stays below the 10-week SMA, the bears stay too, and the SMA is downward-sloping…
The silver lining in that is though that the further down it slopes, the easier it will be to eventually break.
The bottom line: if you want an early clue about the eagerly awaited bullish reversal, keep your eyes on the weekly chart and the 10-week SMA.
Currently trading at $3,646, BTC seems to have been a victim of whale price-manipulation lately. This alleged manipulation is what brought about the 3 consecutive sharp price-drops, followed by a similarly sharp and about-equal-size price recovery.
What does the fundamental picture say?
In all honesty, the fundamentals are quite confusing these days. FUD pieces in the online press are interspersed with wild rumors (such as the one about Russia preparing to snatch up some $10 billion worth of BTC) and bits of real news which can (and are) twisted both ways, such as the recent acquisition made by Bakkt.
What is certain though is that the ongoing US Government shutdown is not helping the cases of ETFs and Bakkt, which are currently under consideration by the CFTC and SEC – government agencies which – you’ve guessed it – have both been affected by the shutdown.

Forextraders' Broker of the Month
BlackBull Markets is a reliable and well-respected trading platform that provides its customers with high-quality access to a wide range of asset groups. The broker is headquartered in New Zealand which explains why it has flown under the radar for a few years but it is a great broker that is now building a global following. The BlackBull Markets site is intuitive and easy to use, making it an ideal choice for beginners.