The BTC/USD pair has been trading in an obvious bullish pennant chart-pattern lately, a pattern so obvious indeed, that anyone closely monitoring the price evolution of the world’s top cryptocurrency could pick up on it, without ever having to take a peek at an actual chart. From a technical perspective, this narrowing price-range means that the bulls are gathering steam for yet another breakout.
Despite our obvious reservations regarding the relevance of technical analysis in regards to predicting Bitcoin’s price evolution, we have to admit that lately, the technical angle has proven reliable. The market seems to have settled, and when all time highs are not falling on an hourly basis, the technical factors seem to be proper indicators of what’s going on and where things may be headed.
Last Wednesday, the rally from the low of $6,425 all the way to above $9k, ran out of momentum. The bulls were winded, but overall, prompted by a bearish outside-candle pattern, they merely took a breather. They never allowed the price to return to sub-8.8k levels, and now, they’re about ready to start upward again.
Granted, several critical resistance levels held over the last week, keeping the price below $9.5k. This time around though, if the can of bull whoop-behind is opened (signaled by an upward breakout from the currently narrowing pennant pattern), it is likely to take the price well north of $10k, all the way to $12k – according to bullishly-biased analysts.
What major resistance-milestones are we looking at, if the bull breakout does indeed come about? One such level – marked by the 200-Day MA – is the $9,970 one. The psychological significance of the $10k level cannot be ignored either. If this resistance is left in the dust, the bulls may indeed gain another spectacularly powerful boost.
This second boost may take them all the way to the $11.3k mark, which is a major Fibonacci retracement milestone of the drop from $19.8k to $6k.
If however, the less likely scenario comes into effect and the bears prove stronger, we’re looking at a much weaker drop to the $8.4k support level, defined by the Fibonacci retracement of this last mini-rally (from $6.4k to $9.7k). That makes it clear, that even in this case, not much stock is put into what the bears can accomplish.
A true bear revival would only come into effect at that $7.8k price level, and that seems squarely out of reach at this point.
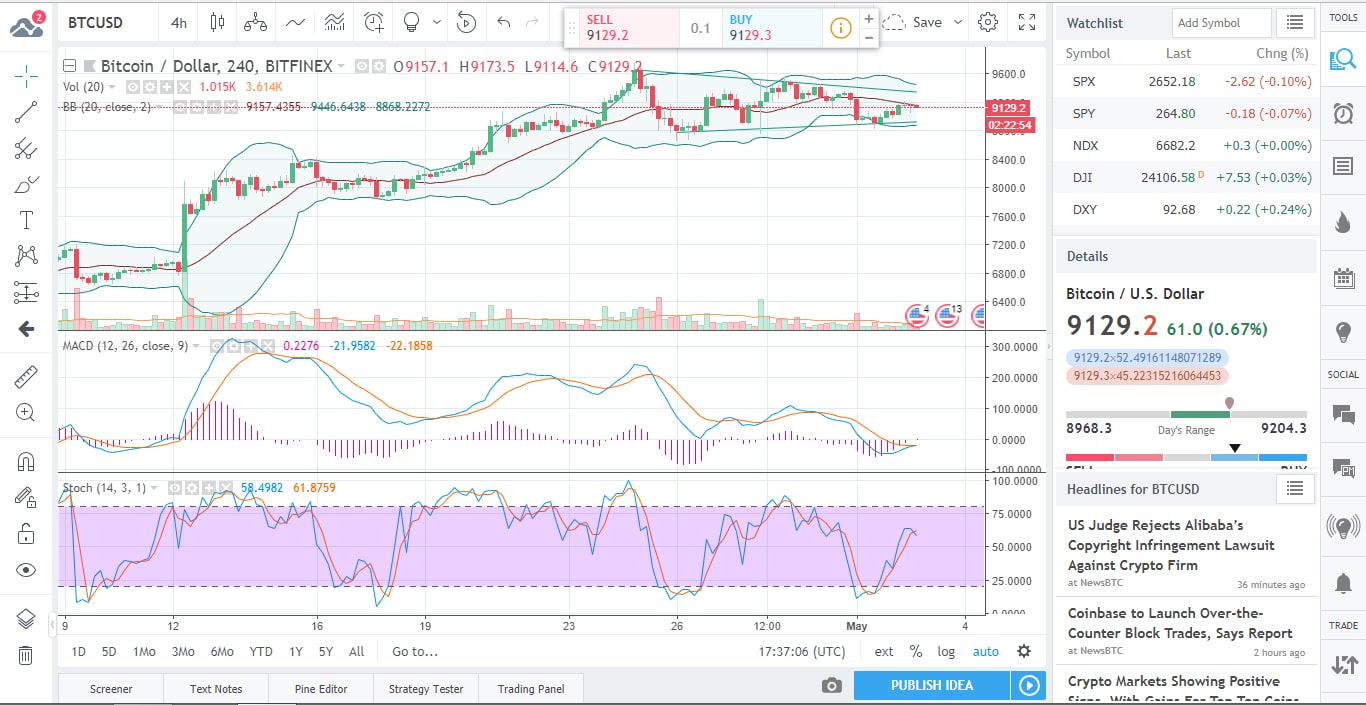
The above said pennant pattern is clearly visible on the 4h chart, as is the fact that the stochastic oscillator is far from indicating overbought conditions, further strengthening the case of the bulls here.
In fact, the majority of technical indicators point to Buy at this point. While the oscillators are a little more reserved in this regard, the MAs have their monies squarely on Strong Buy.
What about the fundamentals though?
It is safe to say that the news coming in are fairly neutral. There are all sorts of moves made with effects that may not impact BTC/USD in any shape or form. The bit about George Soros’ investment group reportedly making a foray into crypto is old news at this point, and nothing of even remotely comparable significance is on the horizon right now.
Apparently Barclays – contrary to recent rumors – do not have any immediate plans to launch a crypto trading desk after all…make of that what you will in relation to the pair under discussion here.
That said, at this point, given all the above-described technical going-ons, it is safe to assume that neutral fundamentals actually favor the bulls as well.

Forextraders' Broker of the Month
BlackBull Markets is a reliable and well-respected trading platform that provides its customers with high-quality access to a wide range of asset groups. The broker is headquartered in New Zealand which explains why it has flown under the radar for a few years but it is a great broker that is now building a global following. The BlackBull Markets site is intuitive and easy to use, making it an ideal choice for beginners.