Bitcoin has been feeling the pull of the bears lately. Following a tentative attempt to break through the $10k psychological resistance level at the beginning of the month, the bulls completely ran out of steam. They’ve been yielding ground in bigger and smaller spurts ever since, but earlier today, they seemed to have mustered some sort of momentum…
The possible mini-rally quickly ran out of steam though and at the time of writing, it looks like it will not take actual shape after all.
What really happened though?
Earlier in the day, BTC hit its 4-day high at $7,560, looking to push further up and maybe hit and surpass the bearish 10-day MA at one point. Situated at $7,562, the 10-day MA bore special importance, given the fact that in this instance, it would have acted as a confirmation of the bullish short-term trend-reversal.
The bears were visibly shaken by a combination of factors, which pointed to an impending bullish reversal. One such factor was a bullish bias in the price-relative strength index divergence, and the other was a bullish candle pattern which materialized on Monday and Tuesday.
Analysts were awaiting confirmation before getting onto the short-term bull-run bandwagon, but that confirmation fell short of the mark, as said above.
Another major milestone is represented by the 50-day MA on the 4-hour chart, another hurdle that turned out to be too difficult to overcome for the feeble bulls.
That said and with BTC currently trading at $7,321, the mini rally can pretty much be declared stillborn.
The overall conjuncture remains a bearish one, punctuated by the downward sloping 50, 100 and 200-day MAs.
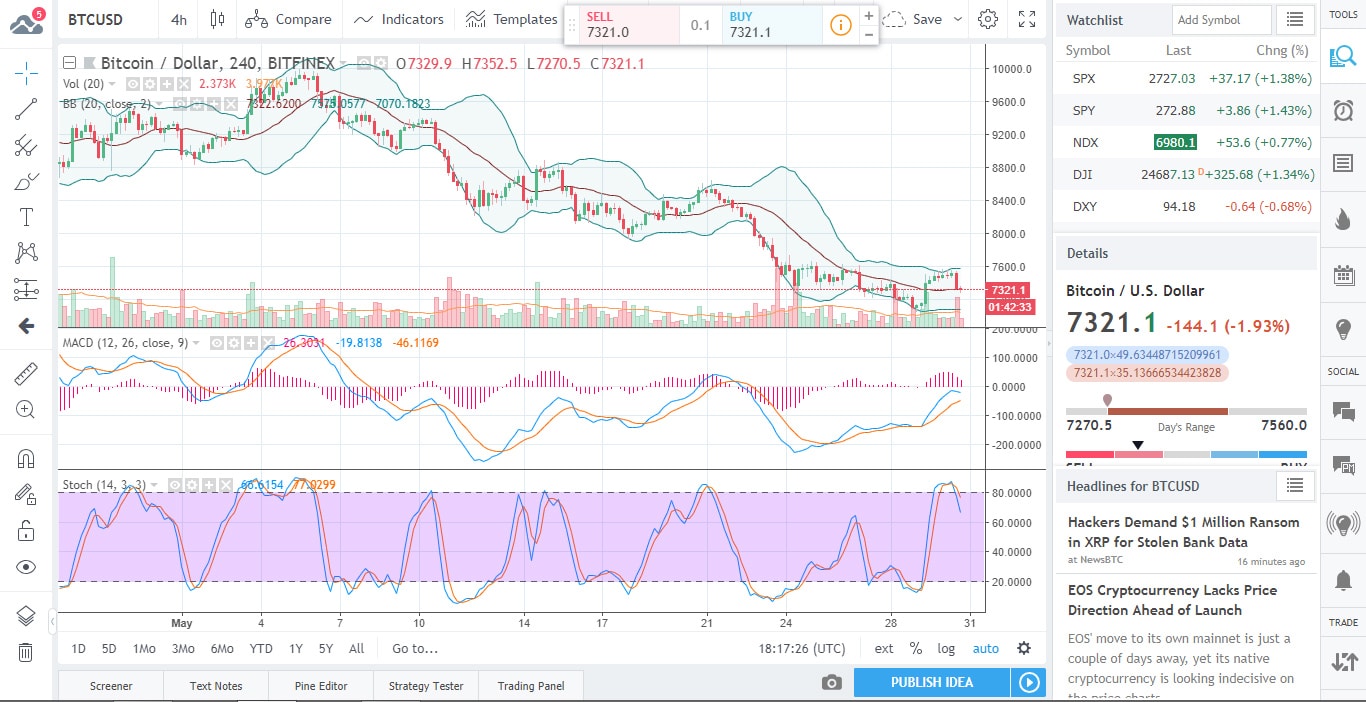
As visible on the 4h chart above, the stochastic oscillator made a perfect prediction of this apparently unexpected and early bull exhaustion, and it continues to indicate further bull weakness.
What exactly does that mean for the immediate price-action? If the current trend is maintained, the price will likely revisit the $7,100 mark.
If however, the rally resumes, and the price moves past the 10-day MA, a move up all the way to the $7,930 mark, defined by the descending trend line, is easily possible.
The short-term bearish outlook has been neutralized, but the long-term one continues to be bearish – as shown above.
Technical indicators tell the same story across the board. The oscillators are neutral: 9 of them at least. The MACD level says Sell and the Momentum says Buy.
The Moving Averages clearly spell out Sell though. 13 of them are in the red, while one is neutral and another points to Buy.
What about the fundamentals?
At such times of relative short-term uncertainty, they can indeed tip the balance one way of the other as they gain additional significance.
South Korea’s Supreme court handed down a ruling, according to which, cryptocurrencies will henceforth be considered property subject to forfeiture in criminal cases.
As an immediate result, some 191 BTC have already been seized, in relation to a cyber crime the perpetrator of which is currently in jail and liable to pay a $640k fine.
Given that there are scores of ongoing criminal cases in the country, involving cryptos, the ruling has far-reaching legal-reference value. Cryptocurrency mining and trading frauds shall doubtlessly also be affected by the decision.
In other news: cryptocurrency mining has shaped the hardware industry for quite some time now, and as a defining and innovation-spurring force, it is apparently here to stay.
Hardware maker Asus has just launched a new motherboard, which can accommodate no fewer than 20 GPUs. According to Asus, the H370 Mining Master represents the second generation of the company’s crypto-related products.

Forextraders' Broker of the Month
BlackBull Markets is a reliable and well-respected trading platform that provides its customers with high-quality access to a wide range of asset groups. The broker is headquartered in New Zealand which explains why it has flown under the radar for a few years but it is a great broker that is now building a global following. The BlackBull Markets site is intuitive and easy to use, making it an ideal choice for beginners.