Yesterday, Bitcoin, the most popular cryptocurrency, survived a bit of a scare which occurred at the end of a bullish run through which, it had successfully reeled in the $8k price-level. The said scare saw it dip to $7.8k before the bulls fought back, bringing it back over the $8.1k mark. What exactly caused that short-lived dip and where is the price likely to head now?
For months, BTC felt the pull of the bears, and over the last week or so, it has finally turned the tables, giving the bulls a bit of a breathing room. This mini bull-run took the price of the currency past the $8k mark and it appeared to settle there, for a breather, before further upward action. An incident may have sought to put an end to that though: the sudden price-dip mentioned in the intro occurred after a major holder dumped some $50 million worth of BTC in a single Bitfinex trade.
Coupled with some other – more or less unsavory – news, regarding the scrutiny to which the New York Attorney General is looking to subject the exchanges operating in the Empire State, the dumping managed to throw a wrench – albeit but a temporary one, as it later turned out – into the generally optimistic outlook that has developed around BTC and the crypto market in general. The simple fact that this shock was shrugged off so elegantly, has made an even stronger statement in this regard though. If someone’s plans were to artificially push BTC’s price down through the move, it is now safe to say that they have thoroughly backfired.
The dip and come-back also established the $7.8k area as a strong support level for the future.
What now though? Let us take a closer look at what technical analysis tells us regarding the likely direction of price evolution.
On the 4-hour chart, the 50-day MA and the 200-day MA both seem to give the green light to the bulls. Indeed, the price itself has cut through the descending trend line, a development the symbolic/practical significance of which cannot be ignored. With the bearish pattern now broken and shoved aside, we may indeed witness a push to the $8.3k-$8.4k area, where the daily chart currently defines a resistance level.
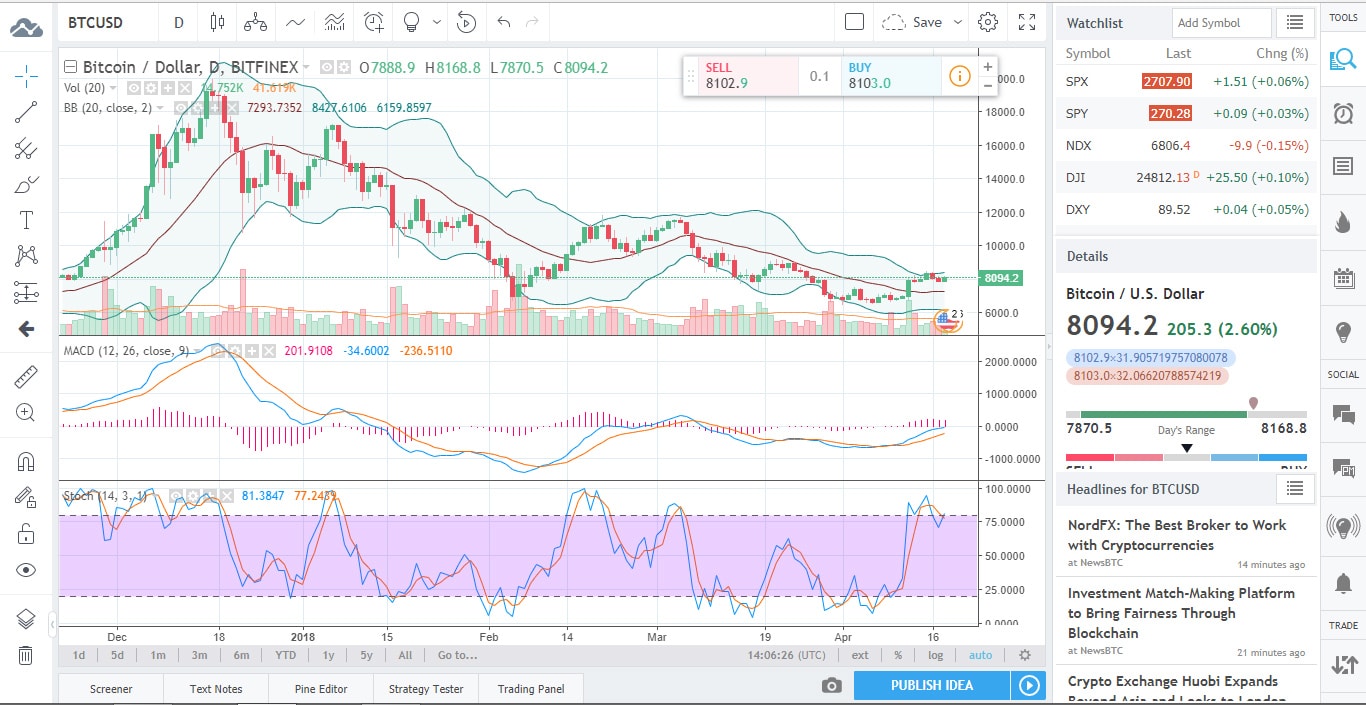
Most technical factors point to the fact that BTC may reach that resistance level in as little as 24 hours. If it does reach it, a high-volume close above that level may truly provide some further fuel to the as-yet-cautious bulls and finally signal a long-term trend reversal from bearish to bullish.
If there’s a downward move, the level to watch is obviously the $7.8k one. A break bellow that support could mean a pullback all the way to $7.5k, which could indeed also materialize within as little as 24 hours.
To get a more or less clear indication of the ending of the current bull run though, the price would have to end up below the ascending 10-day MA.
A quick glance over all the technical indicators yields a rather inconclusive/neutral conclusion. Both the Oscillators and the MAs are perfectly balanced, with an equal number of them pointing to “buy” and “sell”, while the remaining ones are stuck on “neutral”.
What are the fundamentals likely to exert a short-term influence on the price action?
The waters seem to be rather neutral in this regard as well. The Philippines are threatening crypto-fraudsters with jail, while efforts are underway to unlock some $264 million in ETH, that were lost due to a code-failure.
In China, the police have cracked down on a crypto pyramid scheme, which defrauded some 13,000 people, to the tune of $13 million.

Forextraders' Broker of the Month
BlackBull Markets is a reliable and well-respected trading platform that provides its customers with high-quality access to a wide range of asset groups. The broker is headquartered in New Zealand which explains why it has flown under the radar for a few years but it is a great broker that is now building a global following. The BlackBull Markets site is intuitive and easy to use, making it an ideal choice for beginners.