Despite BTC’s technical factors turning long-term bullish for the first time in the last 8 months, the crypto blue-chip registered a sudden and massive drop, which took its price below $7k again, triggering talk of a possible bull trap. Indeed, the scenario is not exactly unheard-of for BTC during this current bear run. Are we witnessing history repeating or is it an entirely different ballgame this time around?
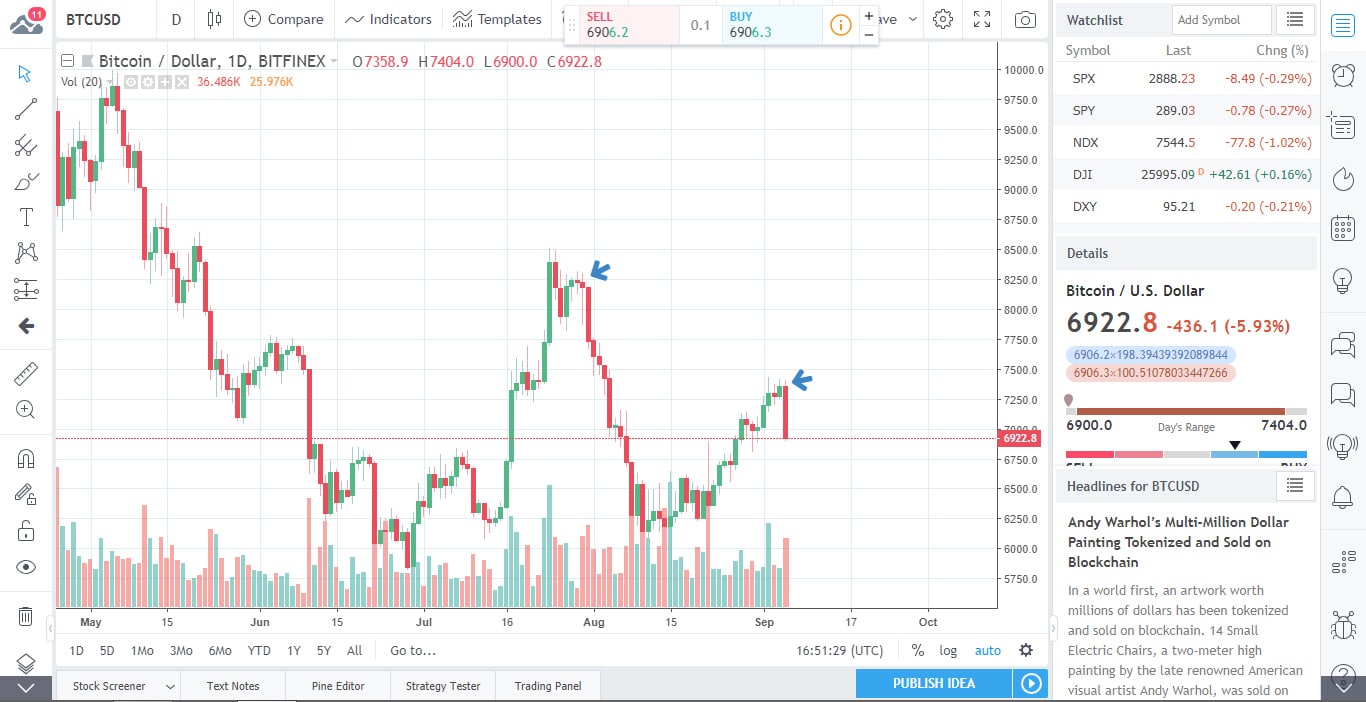
At first glance, the first of those two options seems the be the one turning true. Having probed the $7.4k level, the price of BTC managed to finally break out of a falling channel, defined by the March 5 and May 5 highs. This moment of “triumph” – which followed assessments, according to which the largest crypto had found its bottom earlier in August – turned out to be a truly fleeting one though.
Since its first drop, which saw the price dive to $6.9k, a second one came about too, which sank the price to $6.4k – where it currently hovers.
In July, a similar breakout attempt was similarly punished by the bears. The weird thing about the move this time around was that technical factors were all healthy and bullish. As such – in technical terms at least – this latest price-drop simply cannot be explained.
By contrast, the July bull-trap was preceded by the RSI clearly warning of overbought conditions around the $8.5k mark. The rejection by the SEC of a number of BTC ETF proposals also elicited an impact on the fundamentals front. This time around though, neither the technical factors, nor the fundamental ones foretold the drop.
The market had already factored in just about every bad news the SEC can throw its way in regards to BTC ETFs. The RSI was sitting at the 64.50 mark, leaving plenty of space, all the way to the $7.8k mark, yet the bulls still stumbled big time.
Even just a day ago, technical analysis specialists were proclaiming that the break above the falling trend line was still more legitimate than the July one and that the prospects of a long-term rally were still very much alive.
All that seems much less convincing in light of the second abrupt drop mentioned above.
Some even said that the pullback would turn out to be nothing more than added fuel, to lend the price momentum to put the $7.8k resistance (defined by the 200-day MA) to the test.
It was also said though that acceptance below the $6,895 mark (defined by the 100-day MA), would invalidate this bullish outlook, and guess what: that’s where we are right now, by quite a margin no less.
That considered, the bulls that powered this latest mini-rally can be safely laid to rest, and the break above the above-discussed falling trend line can now also be viewed as a smaller-scale repeat of the July one.
What about the fundamentals though? Do they explain the unapologetic way the bulls got rebuffed?
Belgian authorities have issued another warning regarding crypto scams. The warning originated from the FSMA (Financial Services and Markets Authority), which is the country’s top financial sector regulator/supervisor.
The warning came with a list of 28 crypto trading platforms, believed by the Belgian authorities to have peddled “fake” cruptocurrencies at one time or another.
Back in February, the FSMA had issued a rather similar warning.
For the time being at least, it looks like Goldman Sachs have given up on their plans to launch a crypto trading desk. The decision to sideline the project has apparently been made due to unclear regulation in the US, regarding the crypto vertical.

Forextraders' Broker of the Month
BlackBull Markets is a reliable and well-respected trading platform that provides its customers with high-quality access to a wide range of asset groups. The broker is headquartered in New Zealand which explains why it has flown under the radar for a few years but it is a great broker that is now building a global following. The BlackBull Markets site is intuitive and easy to use, making it an ideal choice for beginners.