The price of the leading cryptocurrency has been probing new depths over the last couple of days, and according to technical analysis, this may only be the beginning of some much more poignant short-term woes. It looks like the only thing preventing a drop to around $2,000 is a flimsy concept: that of a supposedly “solid” support level, defined by a technical indicator.
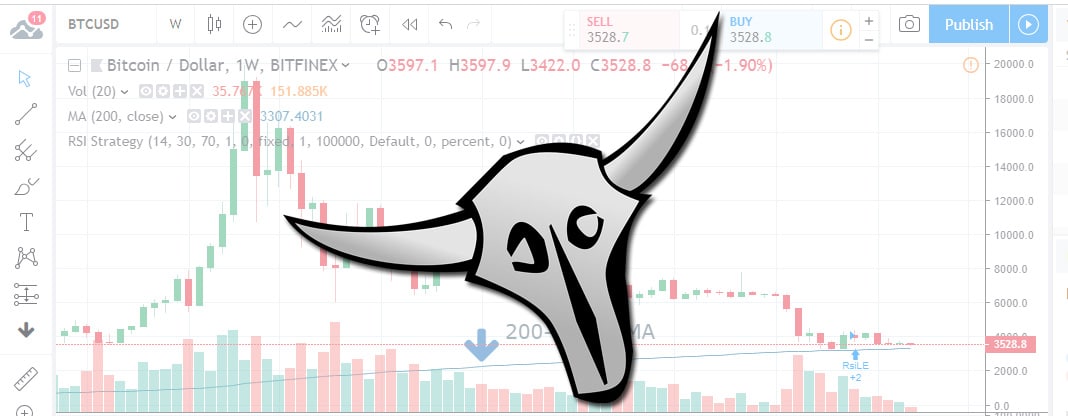
The bears are roaming the streets of Cryptoville in force again, and they have a clear objective: the destruction of the long-term support level defined by the 200-week SMA (Simple Moving Average).
This is the support that has thus far staved off complete capitulation and a drop to fresh depths of the current bear market. The price level to watch is the $3.3k one, where the mentioned SMA is currently located. Currently trading at a little over $3.4k, the price is indeed tantalizingly close to this target.
Why is it likelier now than before that the 200-week SMA will be breached and what happens if it indeed falls?
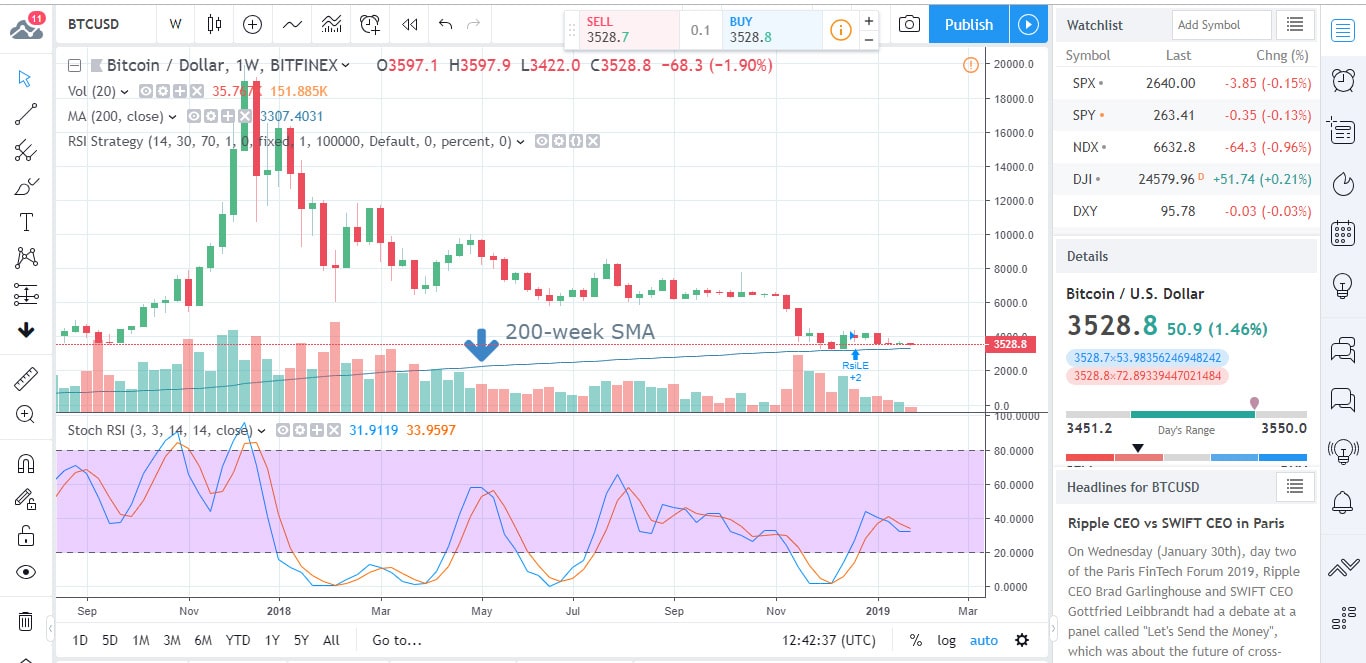
On the weekly chart, the RSI is dropping some ominous clues. It is bearish and it shows undersold conditions. Thus far, whenever the SMA denied the bulls, it did so with the backing of the RSI, that pointed to oversold conditions.
If the 200-week SMA bastion falls, we’re looking at a drop to at least $2,970 – the September 2017 low. That is correct: it is 2017 and not 2018. BTC is facing its lowest price since way back then.
Worse still, the bleeding may not be contained there. Some crypto pundits see the price dropping all the way to $2k.
What about the bulls though? Have they gone missing completely during these times of need? They most certainly have, and only a strong bounce from the 200-week SMA would possibly usher them back into action.
The probability of even a short term bull run of any significance is still very low, even if the above scenario materializes.
Short-term technical analysis points to the probability of a small bounce before the likely descent into oblivion. On the 4-hour chart, the RSI actually shows oversold conditions – and that may indeed be an indication of this last-hooray bounce.
What about the fundamentals?
Apparently detached from the harsh reality of falling prices, news out of the crypto sector have been quite positive lately.
Bitcoin’s Lightning Network has consistently made the headlines, on account of its fast-progressing adoption. Network coders are now considering a proposal aimed at lifting the limit on the amount of money a channel can have locked.
A good metric of Lightning Network adoption is the total amount of BTC locked up in Lightning channels, which is now 574 BTC, up from 1 BTC at the beginning of last year.
In other news: asset management firm Fidelity Investments may launch its crypto custody service as soon as March.
FDSA (Fidelity Digital Asset Services LLC) already has part of the operation – the storage component – in working condition. The addition of the custody service would definitely be another step towards the goal which is institutional adoption.
There is no word yet on when the other components of the much-hyped operation will join storage and custody. What’s certain though is that Fidelity has definitely made its intentions clear in this regard.
Institutional investors have long aspired to join the crypto space, but they haven’t been able to do so, partly because of the lack of a trusted platform and platform provider.
Fidelity aims to be that missing link…

Forextraders' Broker of the Month
BlackBull Markets is a reliable and well-respected trading platform that provides its customers with high-quality access to a wide range of asset groups. The broker is headquartered in New Zealand which explains why it has flown under the radar for a few years but it is a great broker that is now building a global following. The BlackBull Markets site is intuitive and easy to use, making it an ideal choice for beginners.