The price of the world’s top cryptocurrency by capitalization has been struggling under $3,500 for quite some time now, and it looks like HODLers will have to settle for this range for quite a while longer. Despite being oversold – as pointed out by several technical indicators – there are reasons to assume that a major BTC bull bounce is not yet likely. What exactly are we talking about?
While attempting to predict the price evolution of BTC and other cryptos based on technical- and fundamental analysis is a tenuous exercise at best during these trying times, there are a few things we know for certain regarding the current conjuncture, and indeed, some educated conclusions can be drawn based on them.
One of these facts is that BTC is oversold. It is quite obvious from the news of the last couple of weeks alone that this is indeed the case. Lending further legitimacy to this angle is the 14-week RSI, which is stuck below 30 (at 29.80 to be precise), for the first time since the January of 2015.
The RSI is a range-bound indicator, meaning that it moves solely within the 0-100 range. When it hits values above 70, we’re looking at overbought conditions. Below 30, the indicator shows oversold conditions.
To say that BTC was heavily sold lately would be an understatement obviously. From the $6.2k mark, it has essentially been in oversold territory, but thus far, it has failed to mount a meaningful rally. Why is that the case? After all, the above mentioned 14-week RSI points to an impending corrective bounce too.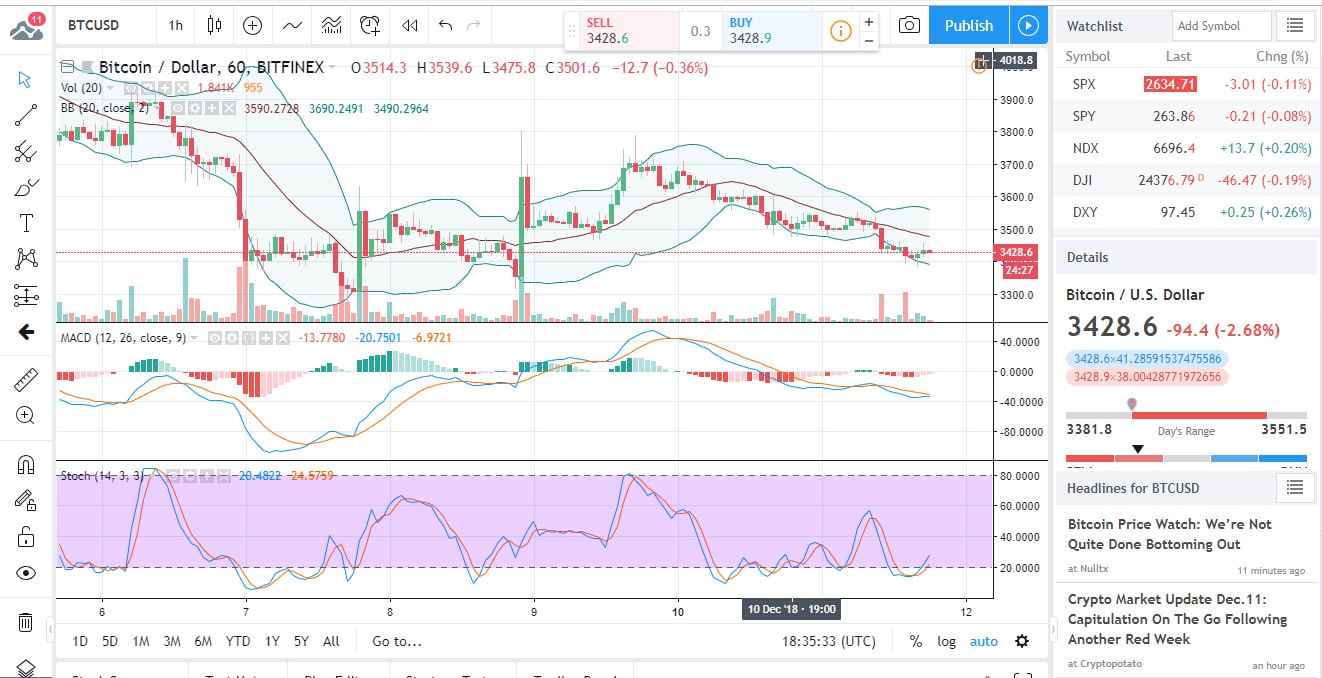
The problem is that the market has settled into a very deep bearish rut, underscored by massive trading volumes, which indicates that the bears are simply not yet ready to be dislodged. That said, the $3.1k support level has thus far held, as did the $3.5k resistance.
Are we in for some more range-bound price evolution or will BTC break out in any direction?
To get anything going upwards, the price first needs to clear the daily chart’s falling trend line – in a convincing (high volume) manner no less. If it manages to do that, we can probably consider the bearish pressure eased somewhat. To be able to talk about any semblance of a bullish reversal, the price needs to beat the $4.4k mark (defined by the November 29 high) – which is pretty much mission impossible right now.
On the downside, we’re looking at the 200-week MA as the support level currently holding up the price (that’s the above mentioned $3,179 support). If the price drops below it, the path will be open to the September 2017 low of $2,972.
Indeed, yielding to the current, overly bearish sentiment, many people fully expect the price to drop that low at least, on its quest for an eventual bottom.
What do the fundamentals say though?
Against the backdrop of the crypto winter, BTC’s share of the crypto market has been steadily increasing. The other day, it has reached a 3-month high, as other cryptos fared even worse through the meltdown.
The highest point of BTC’s market dominance came about on December 6, when the 55.36% mark was hit. This year’s low of 32% was recorded in January.
Whether this means anything in terms of price is unclear, though at this point any good news is more than welcome.
In other news, UK parliament member Eddie Hughes has called for cryptos to be accepted for tax payments.
Hughes said the UK needed to be seen as a progressive country, and therefore, he wanted to see a local authority set up a system that would accept crypto payments.

Forextraders' Broker of the Month
BlackBull Markets is a reliable and well-respected trading platform that provides its customers with high-quality access to a wide range of asset groups. The broker is headquartered in New Zealand which explains why it has flown under the radar for a few years but it is a great broker that is now building a global following. The BlackBull Markets site is intuitive and easy to use, making it an ideal choice for beginners.