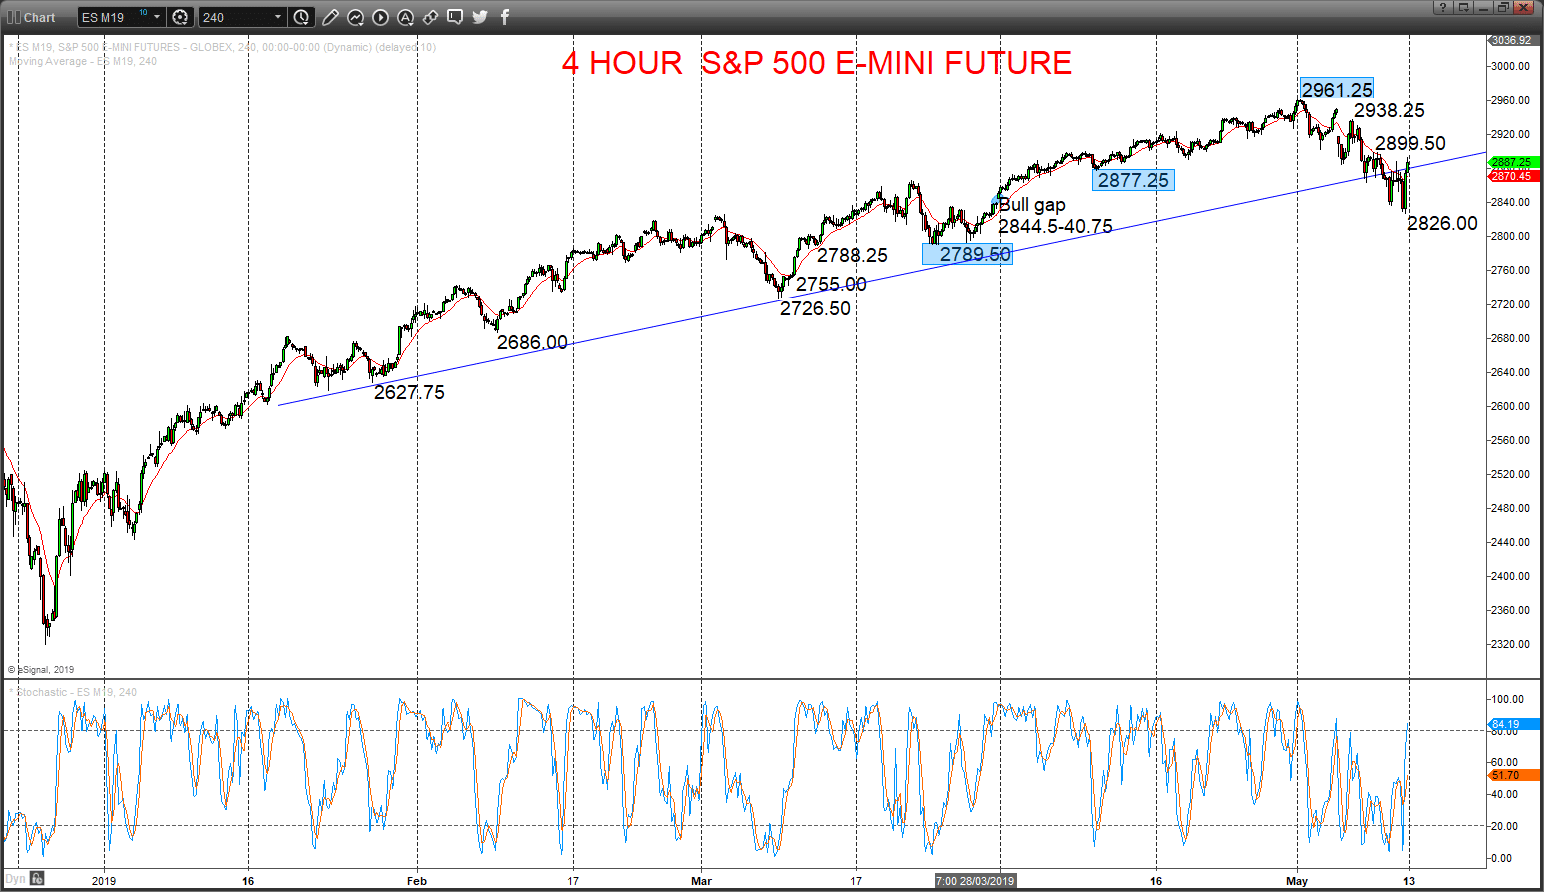
- A global shift to a risk off phase in May has been highlighted by the weakness across equity markets and indices in the US, Europe and Asia, highlighted below by the topping pattern for the US benchmark average, the S&P 500.
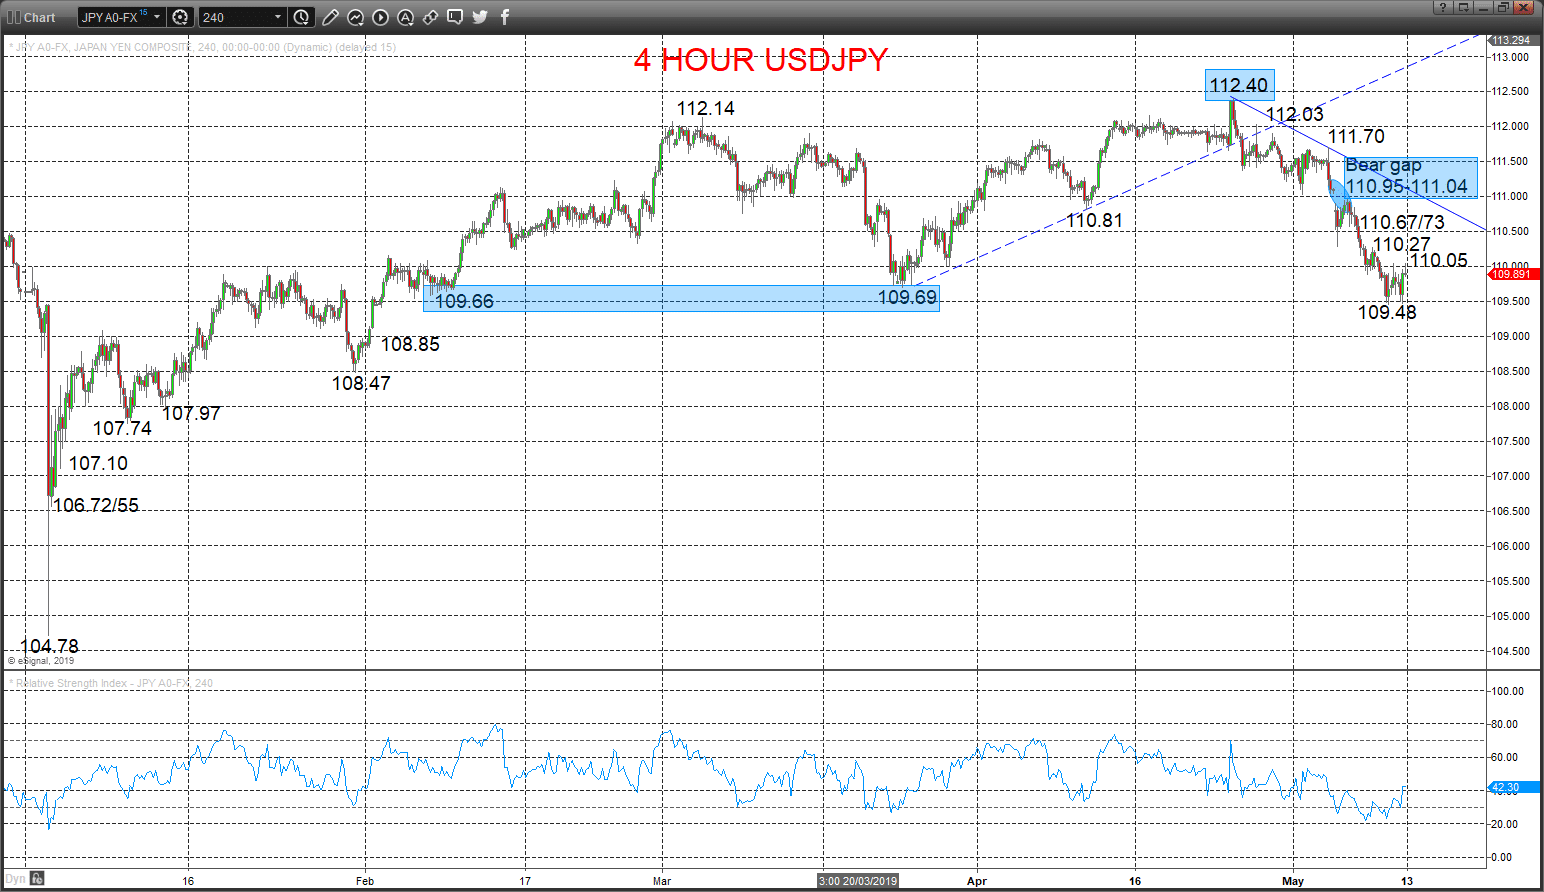
- Moreover, in Forex markets this has seen a flight to quality, with the safe haven Japanese Yen the main beneficiary.
- Below we also spotlight the bear shift and downside risks for USDJPY.
S&P 500 E-Mini recovery threat
A push to a new setback low on Friday but then a firm rebound from above the 2821.25 support level (from 2826.0), to then rally through multiple resistances from Thursday and produce both a bullish outside day and a bullish Hammer candlestick, to shift the bias higher for Monday.
The early May push below key 2877.25 support sets an intermediate-term range we see as 2789.5 to 2961.25, BUT with risk growing for a push below 2789.5 for an intermediate-term shift to bearish.
For Today:
- We see an upside bias for 2893.0 and 2899.5; break here aims for 2908/09, 2921/22 and maybe 2938.25.
- But below 2869/68 opens risk down to 2854/53, then 2837/35, maybe back to 2826.0/21.2.
Intermediate-term Range Breakout Parameters: Range seen as 2789.5 to 2961.25.
Upside Risks: Above 2961.25 sets a bull trend to aim for 3000.0.
- Downside Risks: Below 5 sees a bear trend to target 2726.5, 2686.0 and 2627.75.
Resistance and Support:
| 2893.0 | 2899.5** | 2908/09 | 2921/22 | 2938.25 |
| 2869/68 | 2854/53 | 2837/35 | 2826.0/21.25** | 2813.75 |
4 Hour Chart
USDJPY bear theme intact, despite bounce
A rebound Friday, but an inside pattern, and whilst capped by 110.27 resistance we still see negative pressures from Thursday’s push below key 109.69/66 supports, plus the earlier May bear gap (at 110.95-111.04), leaving the bias lower for Monday.
The May surrender of 109.66 set an intermediate-term bear trend.
For Today:
- We see a downside bias for 109.48/43; break here aims 109.12, maybe even 108.85 and 108.47.
- But above 110.27 aims for 110.67/73, maybe towards the resistance gap at 95-111.04.
Intermediate-term Outlook – Downside Risks: We see a downside risk for 108.47.
- Lower targets would be 107.74 and 106.72/55.
- What Changes This? Above the resistance gap at 110.95-111.04 shifts the outlook back to neutral; above 112.40 is needed for a bull theme.
Resistance and Support:
| 110.05 | 110.27* | 110.67/73* | 110.95-111.04*** | 111.70* |
| 109.48/43 | 109.69/66*** | 109.43 | 109.12 | 108.85* |
4 Hour Chart

Forextraders' Broker of the Month
BlackBull Markets is a reliable and well-respected trading platform that provides its customers with high-quality access to a wide range of asset groups. The broker is headquartered in New Zealand which explains why it has flown under the radar for a few years but it is a great broker that is now building a global following. The BlackBull Markets site is intuitive and easy to use, making it an ideal choice for beginners.