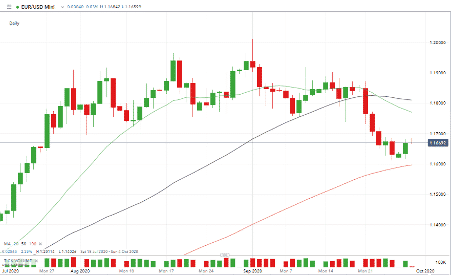
EURUSD continues to throw up negative indicators. Selling pressure over the last week has broken the support line of the holding pattern which started forming back in August.
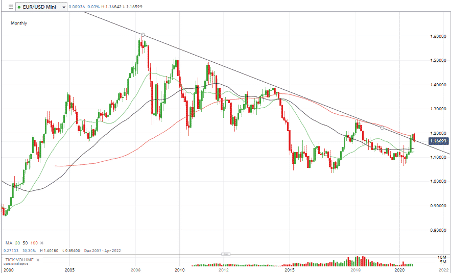
The currency pair is gaining a lot of attention. The question is whether this represents the start of a long-term move in line with the pattern seen in the Monthly chart. If that is the case then target prices could even include parity.
Instrument | Hourly | Daily | |
GBP/USD | 1.2863 | STRONG BUY | NEUTRAL |
EUR/USD | 1.1665 | SELL | STRONG SELL |
FTSE 100 | 5,942 | STRONG BUY | SELL |
S&P 500 | 3,363 | STRONG BUY | STRONG BUY |
Gold | 1,879 | NEUTRAL | SELL |
Silver | 2,250 | SELL | STRONG SELL |
Crude Oil WTI | 40.42 | SELL | STRONG SELL |
Bitcoin | 10,673 | SELL | STRONG BUY |
Our analysis is based on a comprehensive summary of market data. We use a range of metrics with weighting given to simple and exponential moving averages and key technical indicators.

Forextraders' Broker of the Month
BlackBull Markets is a reliable and well-respected trading platform that provides its customers with high-quality access to a wide range of asset groups. The broker is headquartered in New Zealand which explains why it has flown under the radar for a few years but it is a great broker that is now building a global following. The BlackBull Markets site is intuitive and easy to use, making it an ideal choice for beginners.