On Sunday, the price of the leading cryptocurrency took a massive hit, as the crypto markets shed some $11 billion within just a few minutes. Though the bleeding was stopped above the $3.7k mark, the bulls have lost a lot of momentum. Technical analysis now says that the bears might be back in the driver’s seat soon.
Just as the price of BTC appeared to gather some upside momentum, on Sunday, a sudden and rather peculiar selloff struck. It put an end to the mini rally that many were hoping would mark the end of the longest bear market in BTC history.
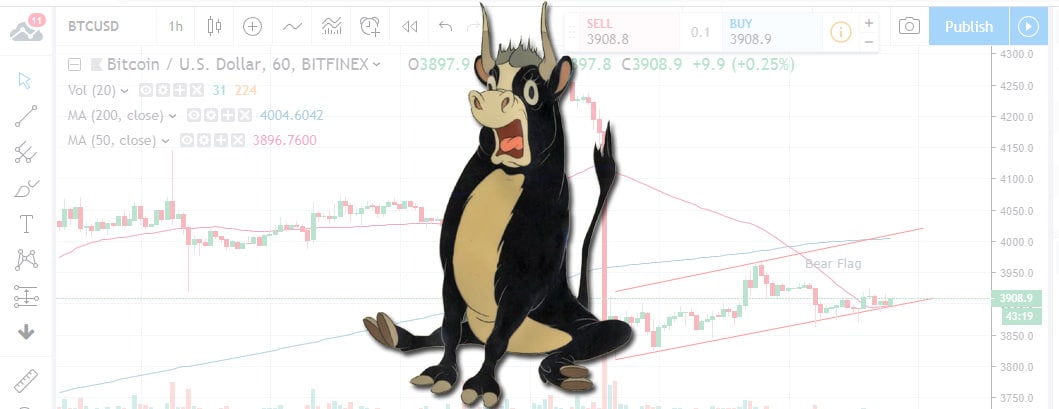
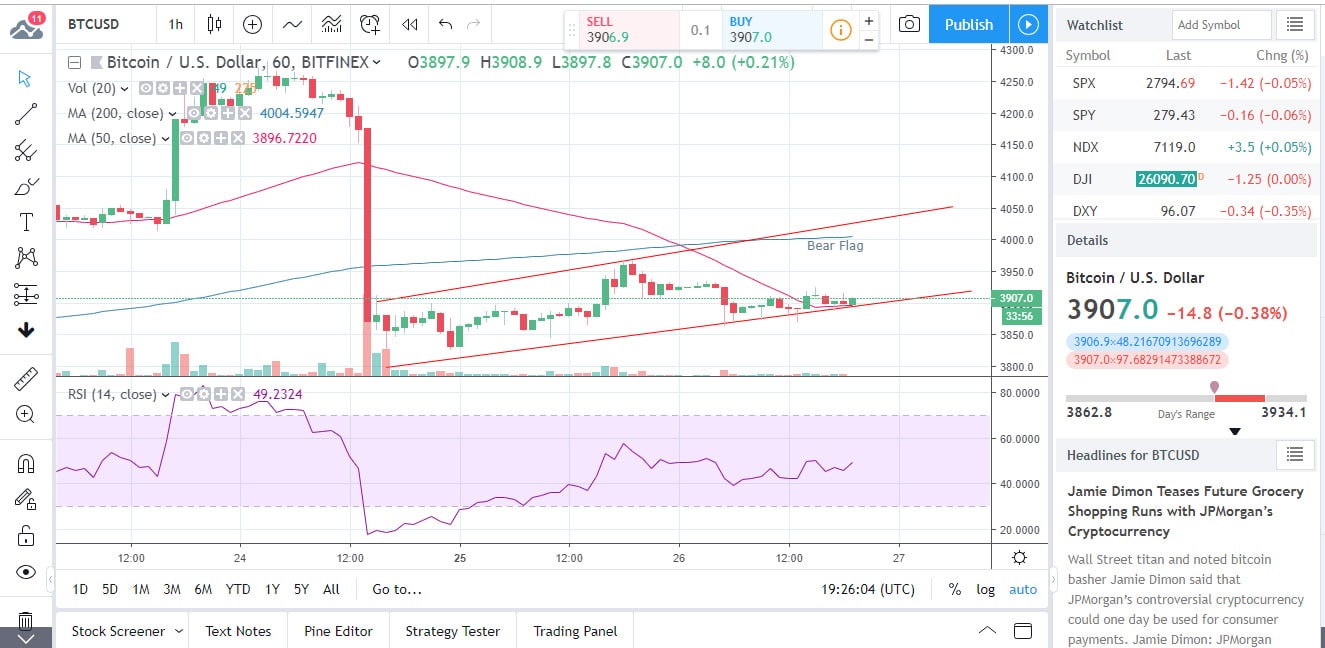
Technical analysis-wise, the charts are unforgiving. The hourly ones show a bear flag pattern taking shape, out of the small bounce registered in the wake of the big drop.
All it would really take for this pattern to put the bears back in charge is a UTC close below the $3,714 mark.
On the other hand, to deflate the materializing bearish trend-reversal, the bulls would need to carry the price over the $4,190 level. That seems quite unlikely right now.
From the perspective of the bulls, the successful defense of the $3.7k level is certainly encouraging. For a while there, the price held fast above $3.8k, but it is currently down to $3,790.
Ping-ponging in this range is not what the bulls need however. For a new rally to take shape, further recovery is needed and it needs to come quickly.
The fact that the overall technical picture – unlike the mentioned momentum-based one – favors the upside, is something of a surprise at this point. That said, objectively speaking, the path of least resistance is still up.
Profit-taking by long positions has been identified as the likely cause of Sunday’s price drop. That said however, short positions fell by some 12% lately, landing near 11-month lows. Fewer people betting on BTC dropping further is as bullish an indicator as it could possibly be.
What about the mentioned hourly-chart bearish flag?
This chart pattern carries the possibility of further losses. If the price breaks out of it downward, more trouble is in store for the bulls. An upward breakout would obviously have an adverse effect.
The RSI also points to overbought conditions and the 50- and 200-hour MAs are converging as well, looking to execute a bearish crossover.
On the daily chart, the 100-cycle MA is the indicator to watch, as it seems to have successfully grabbed hold of the price yet again. Needless to say, an upward break from this level is needed to lend the bulls some much-needed credence.
What about the fundamentals?
Much has been speculated regarding the causes of Sunday’s crypto bloodbath. Some of the likely reasons identified might just be valid indeed.
CME reported last week that on February 19, its Bitcoin futures hit record trading volumes. Speculating on the price of their underlying asset (BTC in this case) such futures do indeed wield enough clout to move the price significantly.
Sell pressure slowly but surely increased on futures over the few days leading up to Sunday’s slide.
The fact that we are simply witnessing a natural pull-back at the end of a strong rally, is also a possibility. Let us not lose sight of the fact that the $4.2k level has indeed been considered a very strong resistance as well. Adding two and two together makes perfect sense in this regard.
As the Bitcoin rollercoaster took off yet again, a major Swiss private bank, Julius Baer, announced that it was planning to offer access to digital asset services, later this year.
The financial regulator of the country, FINMA, needs to sign off on the deal as well.

Forextraders' Broker of the Month
BlackBull Markets is a reliable and well-respected trading platform that provides its customers with high-quality access to a wide range of asset groups. The broker is headquartered in New Zealand which explains why it has flown under the radar for a few years but it is a great broker that is now building a global following. The BlackBull Markets site is intuitive and easy to use, making it an ideal choice for beginners.