There’s little doubt in anyone’s mind that the BTC bears have ruled the crypto roost with an iron first over the last few weeks (and even months), running roughshod over the bulls at every opportunity and striking fear in the hearts of HODLers everywhere. Are we about to finally witness a reversal of fortunes in favor of the bulls though?
Indeed, with the flagship crypto trading at $6,133 yesterday – lower than at any point during the last 70 days – it was becoming more and more likely that John McAfee would have to go through with that unspeakable deed he had promised to perform on national television, as part of a wager concerning the price of BTC, at the end of 2020.
While perhaps nothing in the way of BTCs current price-swings says anything about its long-term prospects, one could not help but get at least a little nervous seeing how BTC in particular (and crypto in general) has not been able to catch a meaningful break for months now.
All that considered though and the current flood of negative news tossed onto the scale too, we may indeed be looking at a reversal that might take the HODLers out of the woods for good.
The cause for this seemingly misplaced optimism resides in a technical indicator, called the RSI (Relative Strength Index) according to which, BTC is currently woefully oversold.
Yesterday, the RSI hit 26.4, a level it last saw in August, 2016. From a historical perspective, since August 14, every time the RSI went this low, a major price-bounce followed.
What is truly interesting is though that the scenario which led to this August 2016 RSI dip, is quite a bit like the one currently unfolding. If history is any indication (and it may well not be), a rally is supposed to come now, one that may take the price of the digital asset well north of the $10k mark, for good.
It is worth noting that since the August 2016 RSI-foretold bounce, the price of Bitcoin never revisited that level, registering gains of over 980%.
Oversold situations in the daily time-frame are rather rare occurrences in the world of Bitcoin. The last such situation occurred on February 6, when the RSI found itself below 30 (though still not as low as yesterday’s 26.4). Even then, the dip was followed by a bounce, which took the price of the crypto from $6,000 to over $11,000.
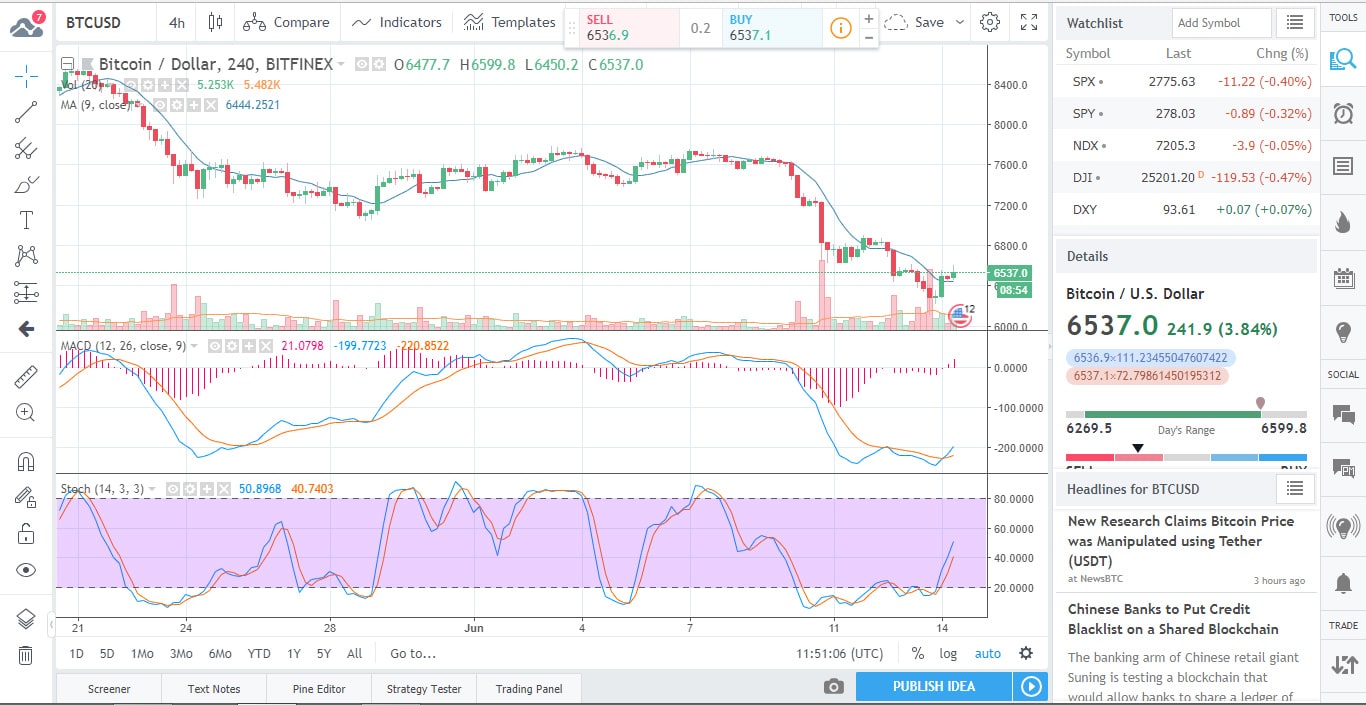
As seen on the chart above, the above discussed bounce may have already begun indeed.
As far as technical indicators are concerned, the MAs (Moving Averages) are extremely Sell-biased. Indeed, if the above said rally does materialize, it will have to deal with some of these MAs as resistance levels. The Hull Moving Average is the only indicator in this category pointing to Buy.
The oscillators on the other hand – more sensitive to short-term momentum variations – are neutral. Some of them (like the Stochastic visible on the above chart) are Buy-biased, while some of them point to Sell. The majority are Neutral though.
What do the fundamentals say?
In objective terms, not much really. The news-flow is mostly negative however, with pieces such as the one that claims to have discovered a link between USDT and the artificial pumping of BTC’s price.
Beyond the fact that this Tether-story is hardly a new one, it is hardly a story at all. Some people used their Tethers to buy the dip – so to speak, and they ended up “manipulating” the price in the process.
Tether is mostly used by bigger investors who cannot push large amounts of fiat USD into the crypto markets.

Forextraders' Broker of the Month
BlackBull Markets is a reliable and well-respected trading platform that provides its customers with high-quality access to a wide range of asset groups. The broker is headquartered in New Zealand which explains why it has flown under the radar for a few years but it is a great broker that is now building a global following. The BlackBull Markets site is intuitive and easy to use, making it an ideal choice for beginners.