The bitcoin price has been on a bit of a range-bound rollercoaster ride lately again. Having recorded some massive gains over the last couple of months, it was hit by a sharp correction a few days ago. Many attributed the twist to market manipulation. The biggest cryptocurrency absorbed the blow however, shooting back up to above $8.2k from $6.1k. Now, it dropped below $7.9k though…
Though far from always reliable, the technical picture explains the latest evolution of the BTC price quite perfectly. The mentioned rebound from $6.1k was a telltale sign of bullish strength. Even with the latest correction, the price has logged double-digit gains for 3 weeks straight.
The weekly and the daily charts still favor the bulls, though the hourly one points to an impending dip to around the $7.5k mark, maybe a touch lower. After that though, everything seems to say that there are no significant resistance levels till the $20k mark.
The short-term target however for the bulls, is $8.5k.
What about those double digit gains? The numbers are in and they say that BTC price rose by some 17.5% last week. Before that, the gains were even more impressive. 22.16% gains marked the peak of the rally, preceded by a 10.62% week.
Under these circumstances, it would require a drastic downward move to hand the short-term reins back to the bears. The price would have to fall below the 30-day MA, which is currently at $6,239.
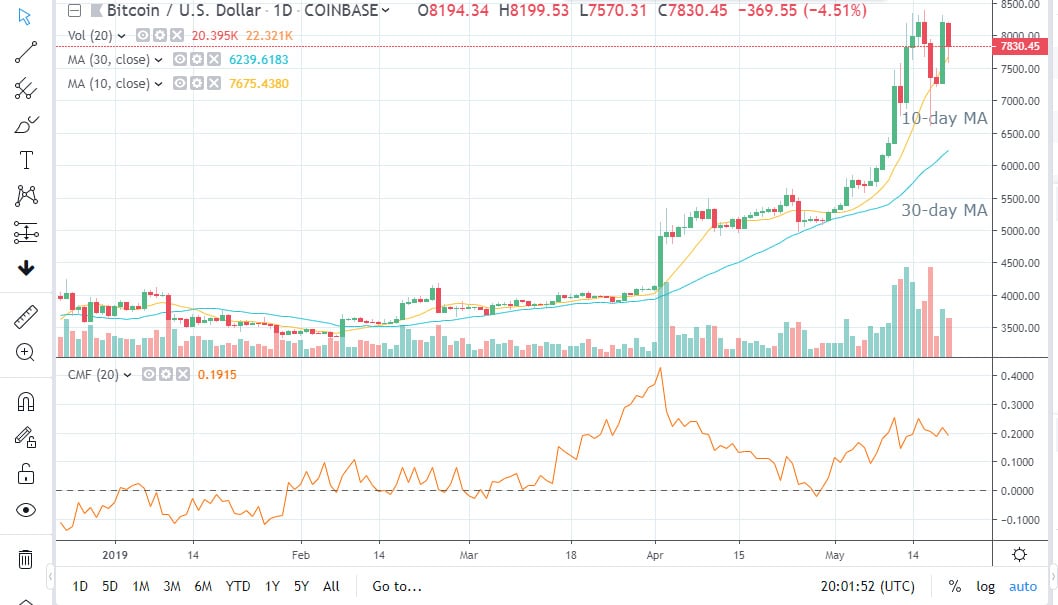
The daily chart flashes all sorts of bullish signals. The 30-day MA slopes upward, as does the 10-day one. The candle patterns show bullish strength too.
The hourly chart is the only one that diverges from the overall bullish picture. The head and shoulder pattern which resulted after the latest rebound, dropped the price out of the rising wedge. Thus, it has neutralized the short term bullish setup. The price has in fact dropped below the $7,848 mark (it is currently trading slightly under it).
What do the fundamentals say though? The price explosion which landed us where we currently are was triggered by fundamental factors. In fact, it sort of flew in the face of what fundamental analysis said at the time…
The news are mostly positive about bitcoin in particular. Apparently, the current institutional FOMO has pumped 90% of the fresh money into bitcoin. Such a dominance of the top crypto is quite unexpected. If you were wondering which coin drove the couple of major pumps we’ve recently seen, now you have your answer.
While at around $8k, the bitcoin price is still a ways off its ATH, in some countries, this milestone has already been reached and surpassed. Due to the rapid devaluation of fiat national currencies, Argentina and Sudan have both logged ATHs already.
Indeed, someone who bought bitcoin at the height of the 2017 bull market in Argentina, is already better off than he/she would’ve been had he/she kept the money in a bank.
Venezuela has made some crypto headlines as well lately. It may have mostly been for the wrong reasons however. While the population does indeed try to circumvent hyper inflation through bitcoin, the authorities use crypto and Russian Rubles to circumvent US sanctions.
In other news, the SEC has kicked the can of the VanEck/SolidX bitcoin ETF further down the road yet again. It requested public consultation on a required rule-change. The new deadline on the decision is August 19. The SEC can then postpone the decision again, till a final deadline set for October 18.
If its current attitude towards the matter is any indication, it will probably take full advantage of that last deadline too.

Forextraders' Broker of the Month
BlackBull Markets is a reliable and well-respected trading platform that provides its customers with high-quality access to a wide range of asset groups. The broker is headquartered in New Zealand which explains why it has flown under the radar for a few years but it is a great broker that is now building a global following. The BlackBull Markets site is intuitive and easy to use, making it an ideal choice for beginners.