Over the last week, BTC has been trapped in a narrow range around the $6,800 mark, going up and down by little, in effect trading sideways for some time now. What exactly does this mean in terms of predictions? While some technical indicators point to the continued prevalence of the bearish trend, others seem to indicate an impending bullish breakout, which may indeed turn out to be much bigger than what we’ve recently seen in this regard.
It is a relatively well known technical analysis theory, that the longer the duration of sideways trading and the wider the range, the more violent the upcoming breakout shall be. In regards to BTC, a week’s worth of sideways trading is indeed eternity, so what really happens when the breakout does indeed come, is anyone’s guess.
The most obvious herald of this building up of bullish (or bearish) energy, is the Triangle pattern defined by the ever-lower highs and the ever-higher lows of the asset price-action (on the 1hr chart). Something really big may indeed be in the works and it would be truly awesome to know at least in which direction the breakout is going to go. The high of the triangle range is at the $7.5k mark, while its low is at $6.4k.
With that in mind, a downward breakout may take the price of the most popular crypto to around $5.5k (a relatively sturdy support defined by the daily RSI at 6k, needs to be factored into that). An upward breakout would probably boost the price to about $7,180, where there’s a major resistance level currently lined up. A break above that level would then signal the beginning of more sustained bullish trend, that may eventually take the price as high as $8,100.
There’s currently a bear flag pattern in play as well, rather clearly visible on the 1hr charts. A downward break from the flag pattern might mean a drop to around $6,150. A major support level, currently located at the $6,570 mark, needs to be factored into that.
The technical indicators offer a rather “Sell”-tinted view of the situation. While the oscillators are overwhelmingly in neutral territory right now (9 point to a neutral outlook, one urges “Buy” and another one “Sell”), the Moving Averages are quite unanimous in their “Strong Sell” verdict.
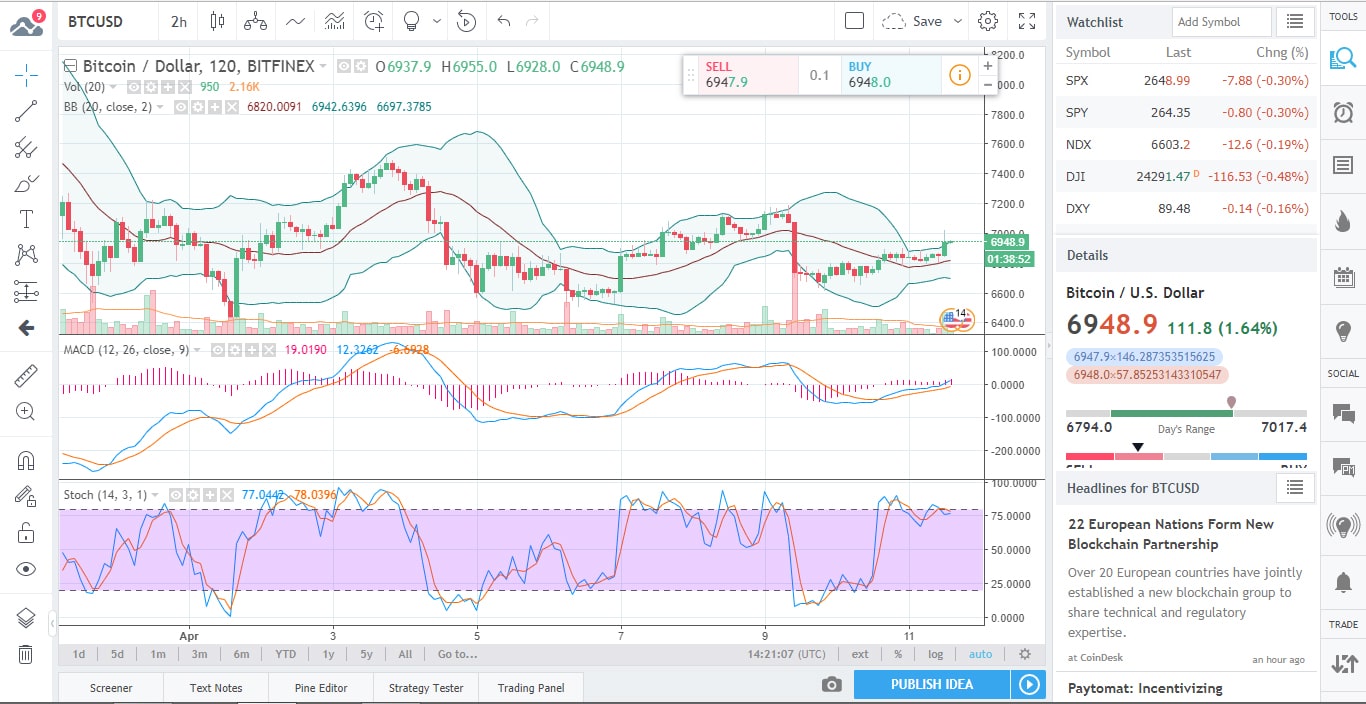
As it can be seen in the chart above, while the price has begun moving towards breaking upward from the above said bear flag pattern, the stochastic oscillator is already straying into overbought territory.
What do the fundamentals say?
While over the last two-three months, news have been overwhelmingly negative in regards to the crypto industry in general and BTC in particular, things have taken a bit of a turn for the better in this respect lately. April 17 is widely seen as a crucial date that may indeed reverse the currently prevailing bearish winds. People are apparently selling their BTCs to pay taxes and that will wrap up on April 17.
Furthermore, in the UK, authorities have begun making moves in regards to crypto regulation, but unlike in some other countries, where the regulatory moves were aimed at the stifling of the industry, in the UK, promotion seems to be the order of the day.
History is yet another reason why BTC bulls may soon breathe a sigh of relief. In the brief history of the crypto currency, Q2s saw significant price-boosts every time. While history does not theoretically impact the future in any way, the psychological significance of this factor should not be underestimated.

Forextraders' Broker of the Month
BlackBull Markets is a reliable and well-respected trading platform that provides its customers with high-quality access to a wide range of asset groups. The broker is headquartered in New Zealand which explains why it has flown under the radar for a few years but it is a great broker that is now building a global following. The BlackBull Markets site is intuitive and easy to use, making it an ideal choice for beginners.