Following the meltdown of the cryptocurrency industry/vertical as a whole at the beginning of this week, yesterday (November 22) was a bit of a mixed bag in regards to emerging tendencies. A tentative rebound-rally/correction attempted to take shape, only to be squashed by the overall bearish outlook yet again. What exactly transpired though and what does it mean for the short term outlook on BTC and crypto in general?
Indeed, what the cryptocurrency world has gone through in recent days is nothing short of a genuine “meltdown”. All cryptos (and yes, XRP fans, that includes your vaunted token as well), suffered massive drops in price, as the overall crypto market cap took yet another major nosedive. Nothing escaped the carnage, which left HODLers bruised and confused.
In times like this, putting things into perspective can help a great deal in making heads and tails of the situation. This is not the first time crypto went through such a carnage, and – from a statistical perspective – it is not even the worst downturn ever. It is in fact the mildest major correction the market has thus far seen. That said, a rebound may well be in the works indeed, although – at least in the short-term – it is not highly likely right now.
The scenario we are currently seeing/living, may indeed turn into one of only two potential options. The end of the previous bear market (around 2015) saw a massive price-drop, before the booster-engines came online and propelled the price to the moon. We may in fact be seeing that “gearing-up” for the jump right now.
The other scenario is a lot less dynamic: this may be nothing more than yet another stage of a the current bear market, from where the prices may go up or down, by less-than-spectacular margins though.
What does the technical picture tell us right now? Following the drop all the way to near-4k levels, BTC sort of attempted a corrective rally yesterday, at one point making it past the $4.5k price mark. To stand any kind of a chance to trigger a more sustained rally, the bounce would’ve had to break past $4.6k, but alas: it failed to do that.
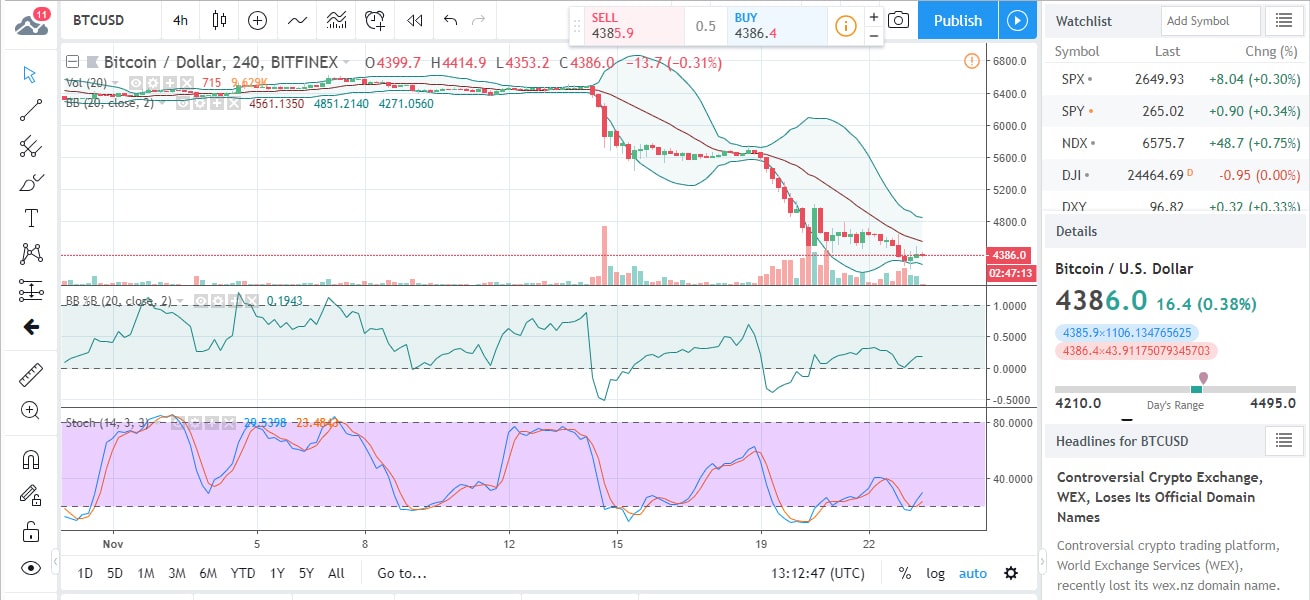
From its unimpressive high, the price dropped again, and one BTC is currently changing hands for about $4.3k.
The precise resistance target to beat is $4,635, defined by the inside candle generated the previous day. Such inside candles usually denote an undecided market, which may indeed be true in this case too, though in this specific instance, the bearish tinge of this “undecided market” is undeniable.
That said, the 200-day EMA at $4,182 has thus far been successfully defended, and that fact – in and of itself – may be an indication of bearish exhaustion.
To get any kind of a reversal going, the price has to break through the above said $4,635 level. Even if it pulls it off, the resulting rally is likely to run out of steam around the $5k level.
Dropping below the 200-day EMA will likely result in more pain for HODLers, as BTC drops down towards $3,100.
What do the fundamentals say though?
The market crash was accompanied by a flurry of bad news. Between the SEC lowering the hammer, the ongoing hash-wars for the BCH laurels and institutional investors looking for the right entry-price, positive news-bits like increased Google Trends interest in BTC do not seem to make a difference. These are bearish times, and unless something major happens in the way of a price-boost, they are apparently here to stay.

Forextraders' Broker of the Month
BlackBull Markets is a reliable and well-respected trading platform that provides its customers with high-quality access to a wide range of asset groups. The broker is headquartered in New Zealand which explains why it has flown under the radar for a few years but it is a great broker that is now building a global following. The BlackBull Markets site is intuitive and easy to use, making it an ideal choice for beginners.