Having aggressively rebounded from a sudden drop down towards the psychological support of $6k, the price of Bitcoin has spent the last few days trading in a narrowing range above $6.4k. As a matter of fact, it has been flirting with the $6.5k mark, crossing it upwards and downwards several times. Does this sideway trading mean that a breakout followed by a more sustained rally might be in the works?
The first event that pointed to the potential invalidation of the bearish bias that lately dominated price-action, was a massive spike on Monday, which saw BTC hit a three-week high above the $6,800 level. While that came and went, it did leave behind the possibility of a rally, further underscored by the above mentioned sustained sideways trading.
Thus far, the bullish breakout has not come about and that is probably due to the fact that traders simply do not believe in it. That’s not the only hurdle in the path of the BTC bulls right now though.
There are a number of solid resistance levels in play too, which the price needs to overcome to show any kind of consistent bullish intentions.
One of these, the falling trend-line drawn from the July 25 high, located at $6,423, has already “fallen” (the current price is slightly above $6.5k).
The $6,823 level has been confirmed as a resistance level by the recent price-bounce from it (on Monday). It was previously established as the September high.
Yet another trend line linking the July and March highs, has set a hurdle at the $7,020 mark.
Right now, we’re looking at some degree of bearish exhaustion, and there are indeed several technical indicators that point to an impending bullish reversal.
Should that come to fruition, we’re likely to see a bounce to just above $7,000.
What technical indicators point to the above said bullish reversal though?
All it takes is one glance on the hourly chart to see that the 50-,100- and 200-cycle EMAs are all pointing upwards. On top of that, the same EMAs have produced yet another bullish signal, as the 50-hour EMA is positioned above the 100-hour one, which in turn is above the 200-hour one.
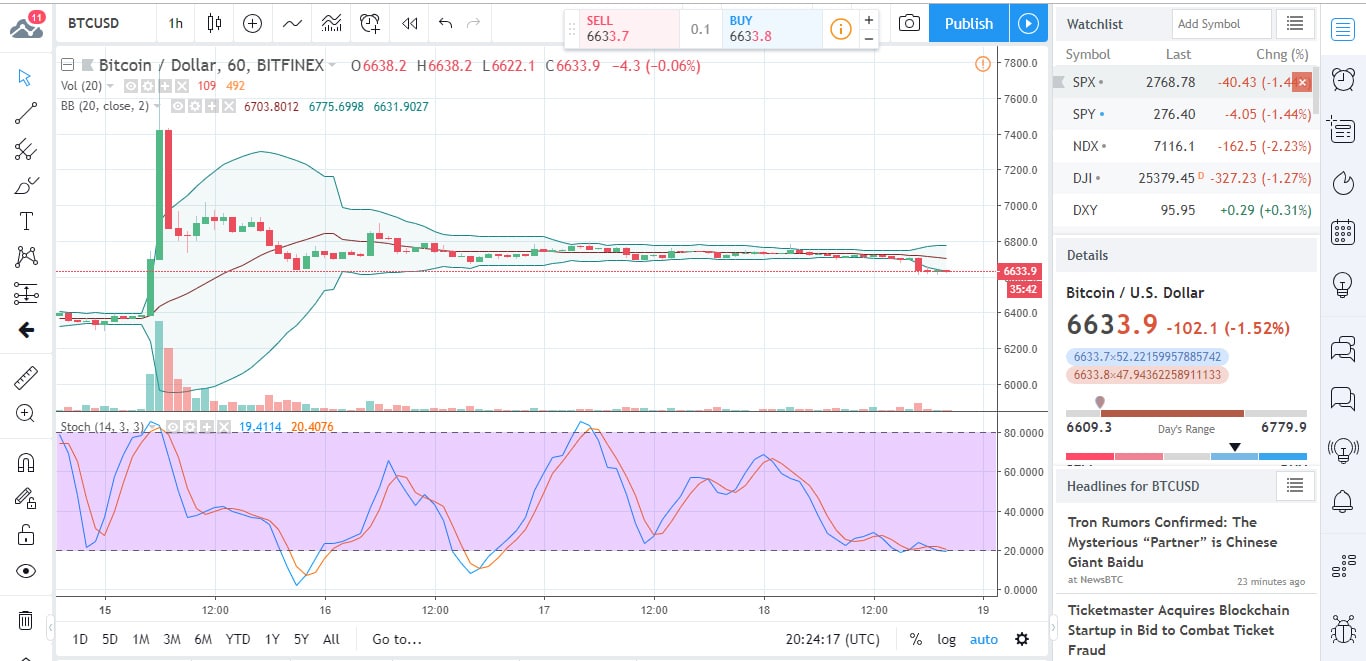
Sticking with the EMAs: on the daily chart, the 5-day and 10-day EMAs are dropping similarly bullish clues.
In conclusion: a triangle breakout from its current confines, would see the price head to $6,800 and then possibly on to the $7,000 level.
A downward breakout from the triangle would revive the bears on the other hand, taking the price down towards $6,000, perhaps revisiting the floor of last week’s drop at $6,151.
Most of the technical indicators (the oscillators as well as the MAs) point to Buy these days.
What do the fundamentals say though?
US Marshals are yet again set to auction off some 660 BTC, currently worth around $4.3 million.
The funds have been seized from a couple of BTC traders, sentenced to jail for crypto money laundering – among others.
The auction is scheduled for November 5, and those interested in bidding are kindly asked to make a $200,000 deposit.
Those who submit their bids won’t be allowed to see the bids of others, or to tweak their own bids after submission.
In other news: the SEC is getting serious about making it easier for ICO-funded startups to understand the legal ramifications of their activities. To this end, the Commission has moved to set up a special division, the goal of which will be to effectively communicate with such operators.
FinHub won’t just deliver information from the SEC, it will also accept questions from industry participants and it will discuss/clarify regulation.

Forextraders' Broker of the Month
BlackBull Markets is a reliable and well-respected trading platform that provides its customers with high-quality access to a wide range of asset groups. The broker is headquartered in New Zealand which explains why it has flown under the radar for a few years but it is a great broker that is now building a global following. The BlackBull Markets site is intuitive and easy to use, making it an ideal choice for beginners.