Although the crypto world just weathered a couple more “bloodbaths” over the last few days, more and more technical indicators turn bullish about the price of the top crypto.
The money flow index is one such indicator, and it has been closely followed by the MACD (moving average converge divergence indicator) which also put up a strong bullish flag.
Is all this the herald of a bullish reversal in the overall market sentiment too? Let us dig a little deeper.
Despite the recent price drops, the overall outlook for the price of Bitcoin has turned quite positive lately. This includes the technical- as well as the fundamental picture.
The news-trickle has been encouraging and sure enough, shortly before we wrote this piece, a major price rally ensued.
BTC’s price has jumped from around $3,685 at one point today, to 3,829, confirming the bullish signals delivered by the MACD and the money flow index.
What exactly do these indicators do however, and how do they make their “predictions”?
The money flow index is extremely interesting in that it takes into account the trading volume as well as the price of the asset to which it is applied. It is a range-bound, oscillator-type indicator, which moves upward (toward its upper limit of 100) when buying pressure is present, and goes downward (towards its lower limit of 0) when selling pressure dominates.
According to the MFI, the price of BTC bottomed out during December 2018, more precisely on December 15, when the low of $3,122 was attained.
During February’s rally, which saw BTC beat its 6-month losing streak, the MFI moved from 25 to 44, pointing to increasing buying pressure. On Sunday, the MFI produced a bullish divergence, accompanied by the crossing of the 50- and 100-day MAs.
The MACD turns MAs into an oscillator-type momentum indicator. It is currently above the 9-period EMA of the MACD, which is the zero mark of the indicator. The higher it climbs, the more obvious the bullish momentum becomes.
The current value of the MACD is above 102, which is its highest level since January 2018.
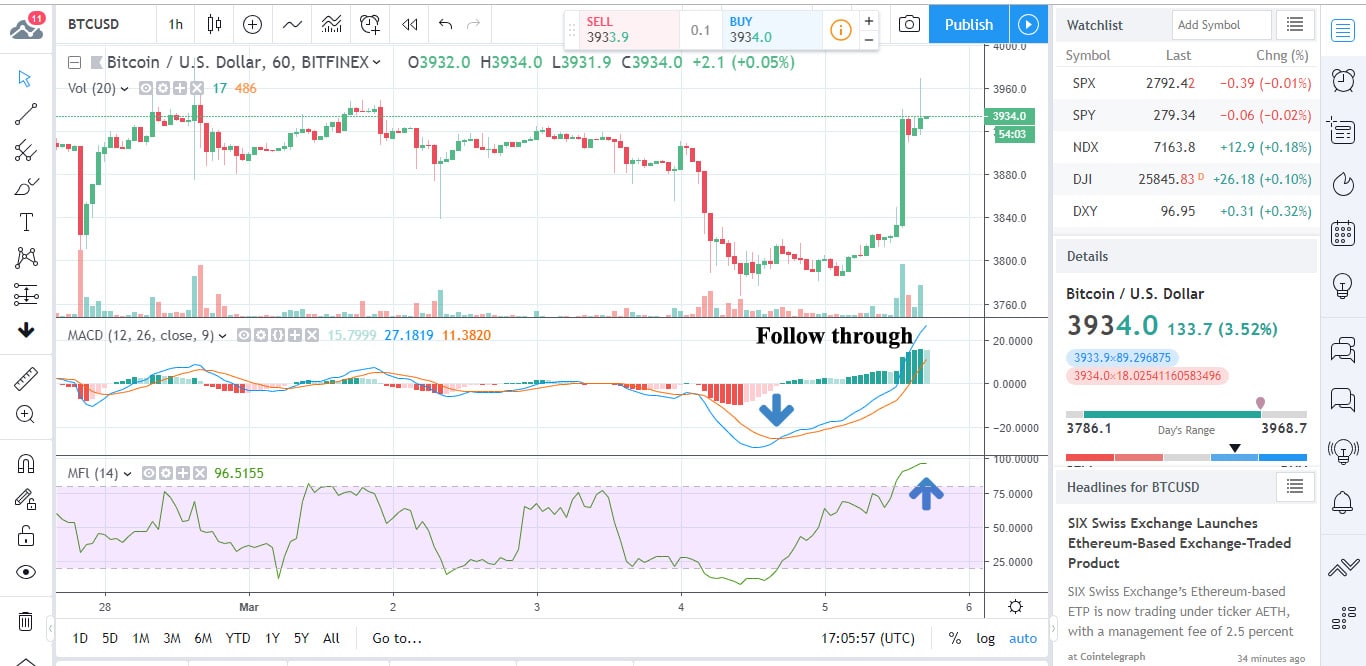
We have to point out that the MACD did generate a rather similar signal last September too, right before the drop from ~$6k to $3k-ish levels, but this time, the follow-through is much stronger.
What do the fundamentals say?
For some reason, the news have been extremely positive for BTC lately. It is almost as if we were dealing with some sort of conspiracy here, which has now set out to pump the price of the leading crypto.
A couple of days ago news broke about grocery retailer Kroger’s plans to ditch VISA and to possibly adopt Bitcoin’s Lightning Network in its stead.
Morgan Creek’s Anthony Pompliano was quick to seize the opportunity. He held talks with Kroger’s leadership team, promising to “hook them up with the Lightning Network” nationwide.
The adoption of BTC’s Lightning Network on such a scale would most probably provide quite a spark towards mass adoption and an example that many would be tempted to follow.
In other news: some crypto pundits seem to believe that banks have grown afraid of BTC and crypto in general. They seem to have realized that the disruption brought by the crypto industry cannot be stopped.
JP Morgan lead the way in this regard. Crypto fear mongering has been CEO Jamie Dimon’s bread and butter for quite some time now. As the events of the last couple of weeks have revealed however, doing everything to slow down crypto is just one part of bankers’ anti-crypto agenda. They’re well into quietly stealing the technology too.

Forextraders' Broker of the Month
BlackBull Markets is a reliable and well-respected trading platform that provides its customers with high-quality access to a wide range of asset groups. The broker is headquartered in New Zealand which explains why it has flown under the radar for a few years but it is a great broker that is now building a global following. The BlackBull Markets site is intuitive and easy to use, making it an ideal choice for beginners.